Graphics reactor examples
Building block list
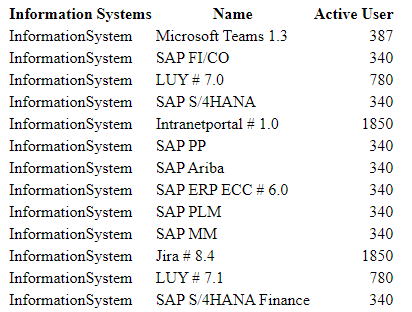
A very simple use case for the graphics reactor: List all information systems that have more than 250 active users. An XSL script that does exactly that can look like this:
This prints a simple HTML table of all Information System having a value of more than 250:
Multi building block list
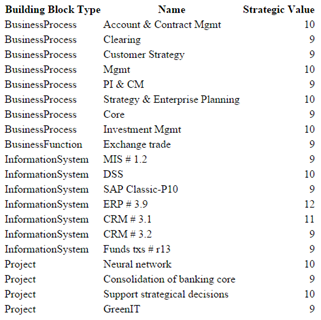
Another use cases for the graphics reactor: List all building blocks that have a high strategic value. An XSL script that does exactly that can look like this:
This piece is everything which is needed to print a simple HTML table of all building blocks having a value of more than eight:
Attributed relations
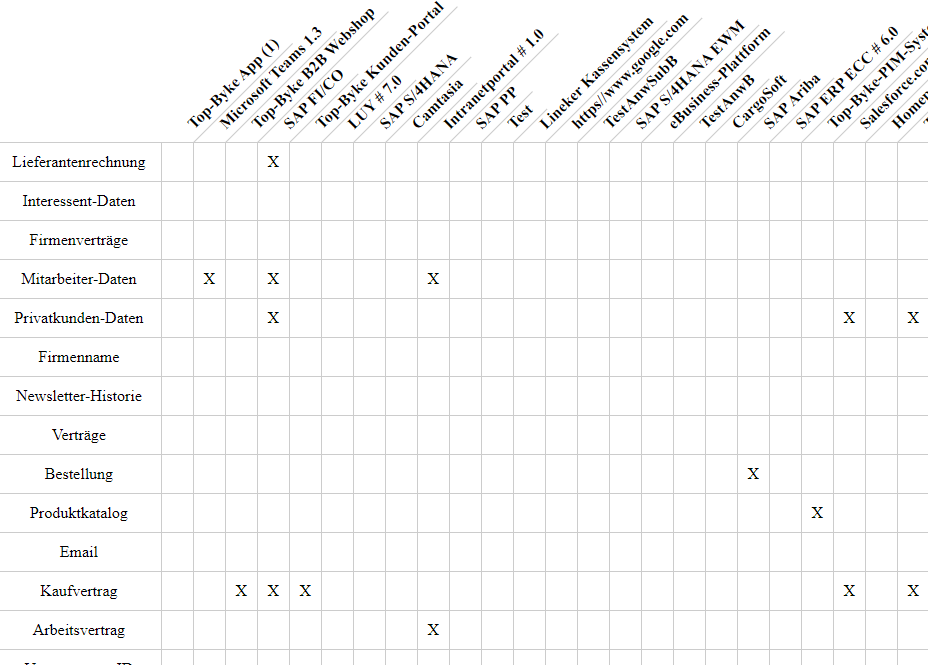
The graphics reactor can also be used to visualize attributed relations like the one between information systems and business objects. In our demo data we have used this relation to specify the operations a system performs on a business object (read, create, update, delete; usually abbreviated with CRUD).
The script GRScript_crudMatrix.xsl builds up a matrix of information systems and business objects that lists this kind of information.
In case a system is connected to an object but no CRUD value is assigned, the field is filled with an X. Together with a handful of CSS the reactor creates this kind of table:
From business down to the bare metal
This example visualizes the connection of business processes to infrastructure elements and includes all intermediate hops through the LUY metamodel.
The result created by the LUY graphics reactor is a graphml file. You can open and view it with the free graph visualization tool yEd (get it here). Based on the sample data in LUY the result will look like this:
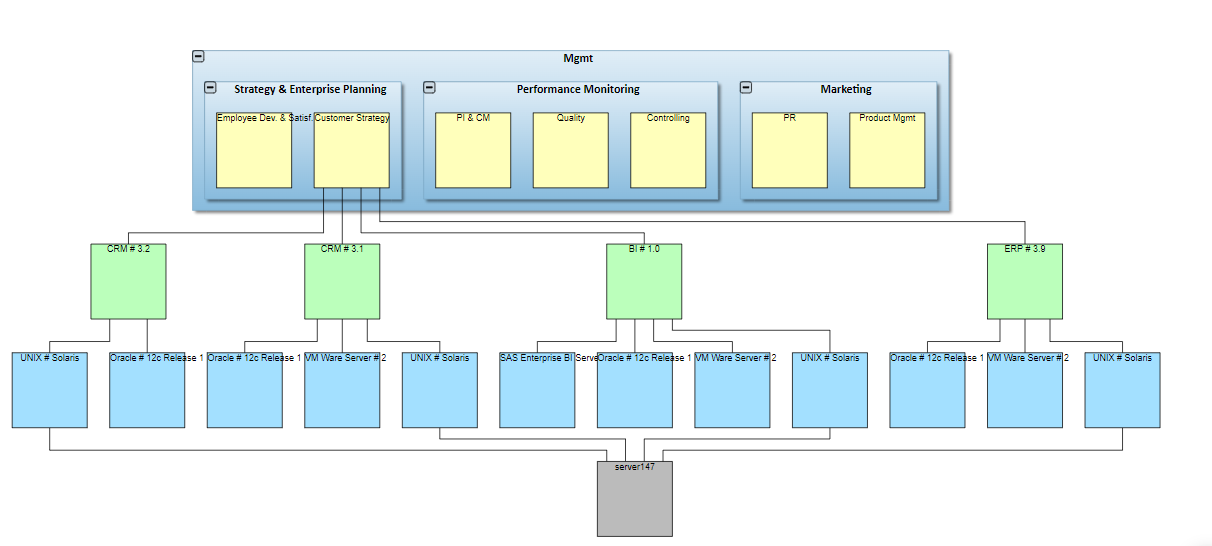
The visualization is produced by the XSL transformation GRScript_fullModLink.xsl.
It depicts all management processes in a nested structure. For the process "customer strategy" it lists all information systems (green) that are supporting this process. The next levels show the necessary technical components (blue) the information systems are built on and the underlying hardware (grey). Of course, the XSLT can be easily adapted to show the same chain for other processes.
All nodes and connections are retrieved from LUY dynamically. The layout is then calculated automatically by yEd. For this example, it is sufficient to open the result file with yEd and select layout > hierarchical with default settings. Once you have done this, you will get a visualization as shown above.
You can utilize all kinds of attributes to influence the appearance of this visualization.
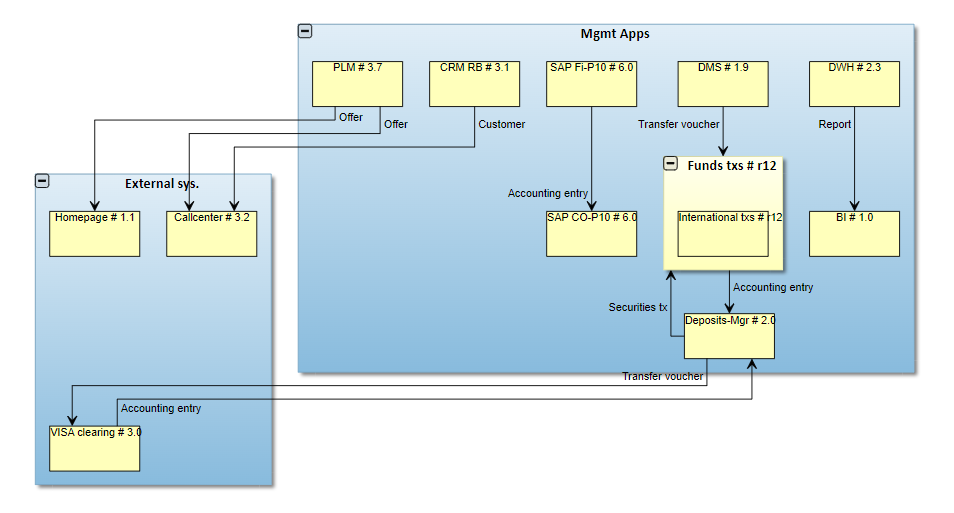
Clustered information flow
This example clusters an information flow diagram according to information system domains.
As for the previous example, the result created by the LUY graphics reactor is a graphml file. You can open and view it with the free graph visualization tool yEd (get it here). Based on the data in LUY the result could look like this:
The visualization is produced by the XSL transformation.
GRScript_clusteredInfoFlow.xsl
Besides clustering the information systems, the XSLT only renders information systems from the domain "Mgmt Apps" that have a connection to external systems or other systems in the same domain. Additionally, the transported business object is included as well as the label of the information flow.
All nodes and connections are retrieved from LUY dynamically. The layout is calculated automatically by yEd. For this example, it is sufficient to open the result file with yEd and select layout > flowchart with default settings. Once you have done this, you will get a visualization like above.
You can utilize all kinds of attributes to influence the appearance of this visualization.
Working with date intervals
Date intervals in the XMI export are represented in unix timestamp format. The example illustrates how to convert a date interval to the human-readable format, which is used for date attributes.
Example XSL for date intervals:
<?xml version="1.0" encoding="UTF-8" ?>
<xsl:stylesheet version="2.0"
    xmlns:xsl="http://www.w3.org/1999/XSL/Transform"
    xmlns:xsi="http://www.w3.org/2001/XMLSchema-instance"
    xmlns:xs="http://www.w3.org/2001/XMLSchema"
    xmlns:iteraplan="urn:iteraplan"
    xmlns:ecore="http://www.eclipse.org/emf/2002/Ecore" >
  <xsl:output method="html" indent="yes" encoding="UTF-8" omit-xml-declaration="yes"/>
  <xsl:template match="iteraplan:Container">
    <h1>Date Intervals XMI Example</h1>

    <table>
        <tr>
            <th>Name</th>
            <th>Runtime Period Start</th>
            <th>Runtime Period End</th>
        </tr>
                <xsl:for-each select="contents[@xsi:type='iteraplan:InformationSystem']">
                    <tr>
                        <xsl:variable name="startDate" select="substring-before(@runtimePeriod, '~')"/>
                        <xsl:variable name="endDate" select="substring-after(@runtimePeriod, '~')"/>
                        <td><xsl:value-of select="@name" /></td>
                        <td><xsl:value-of select='xs:dateTime("1970-01-01T00:00:00") + number($startDate) * xs:dayTimeDuration("PT0.001S")'/></td>
                        <td><xsl:value-of select='xs:dateTime("1970-01-01T00:00:00") + number($endDate) * xs:dayTimeDuration("PT0.001S")'/></td>
                    </tr>
                </xsl:for-each>
    </table>

  </xsl:template>
 </xsl:stylesheet>