Customizing LUY
Standard configuration
The following settings can be adjusted in the first tab of the “customization” tile.
Default language
Customization for default language provides three options:
User selection: each user can change the application language in their user profile
English
German
If “English” or “German” is selected, the default language for all LUY users is set accordingly. In this case, users cannot change their personal language in the user profile anymore.
Set partial limits for diagrams
For each diagram, a so-called partial limit can be set. By doing this, you are restricting the number of elements displayed in this diagram type. That means, whenever the number of elements exceeds the partial limit, only the adjusted number of elements will be displayed.
Whenever there are more elements in a diagram, an info text (1) will be displayed in the diagram legend to inform the user about hidden elements in the diagram.
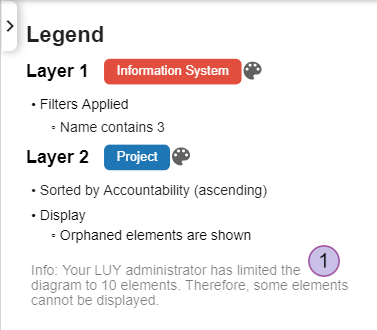
Rendering an exceedingly high number of elements in a diagram can slow down the loading time.
Help menu
The help menu in LUY can be customized by adding customer defined entries. They will be added to the help menu on the top right corner of every page in LUY.
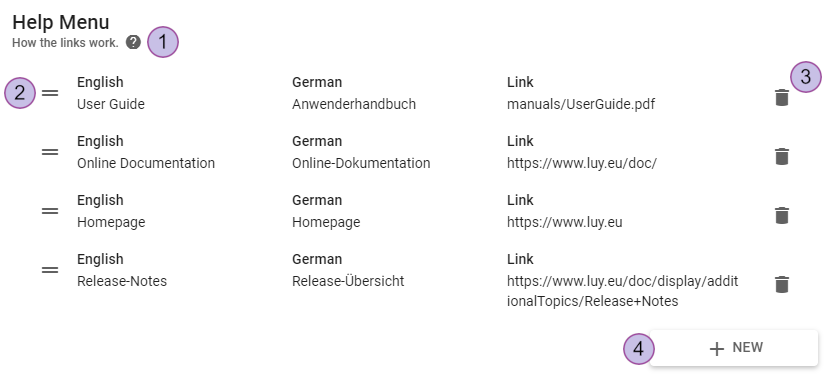
Link to the LUY documentation
Help menu entries, e.g., “user guide”. Both the German and the English display names can be changed by clicking the edit button next to it. The value for “link” should point to a valid URL.
Delete item
Create new entry
Entries can be resorted by drag-and-drop via the drag handle (2).
After deleting all entries, the “help menu” will disappear completely.
Date, time and number format
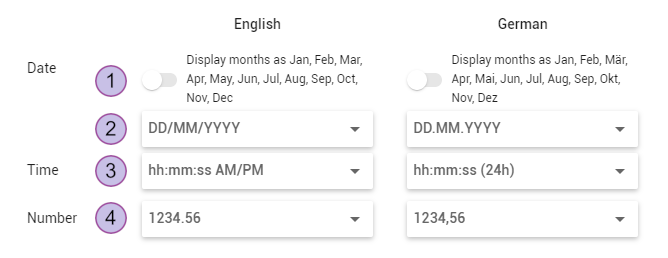
Toggle to show the name of months abbreviated
Date format
Time format
Number format
German and English locals can set different formats.
Structure view
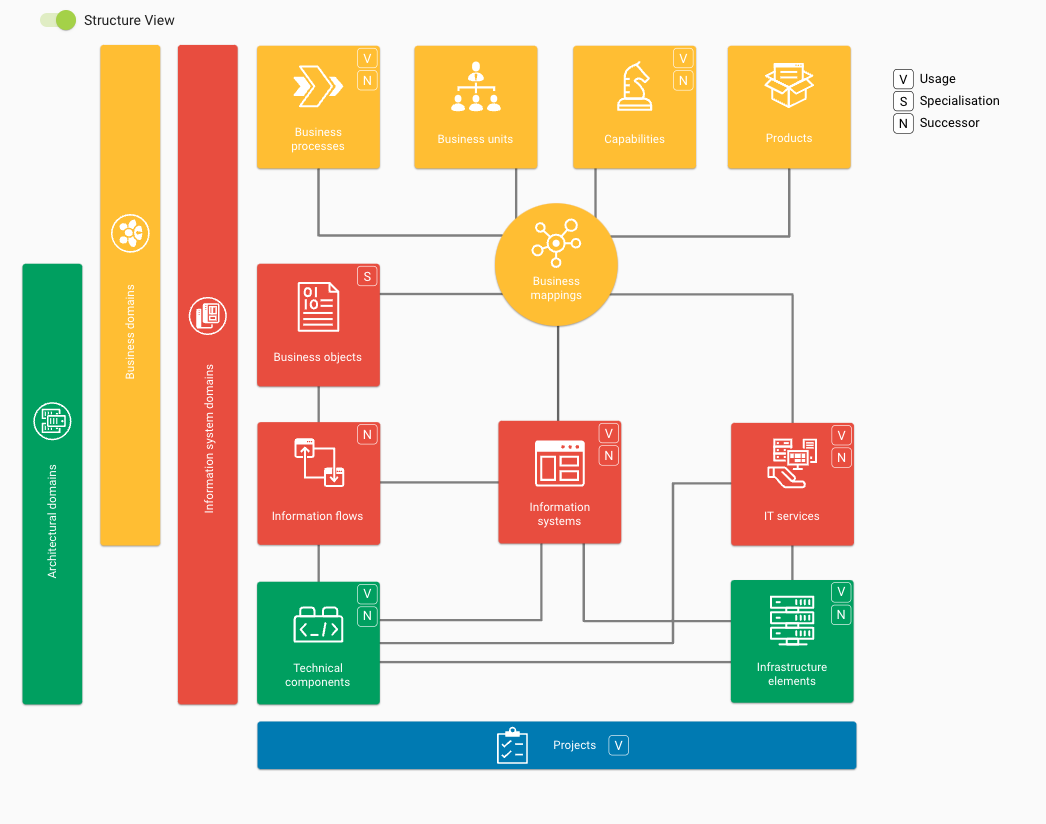
The LUY structure view can be accessed by the “data” tab.
The data tab on the start screen can be switched to “structure view”. The default “structure view” image can be changed for each language by creating a custom image and uploading it. The “structure view” image must be an SVG format and must not exceed the size limit of 10 MB. The default version of the image might serve as template when creating your own image.
The custom “structure view“ image allows embedded links. These links might lead to any desired resource and can also lead to certain pages of LUY. For this case, use relative links. E.g., to link to the business mapping list, use "…/client/#/list/BusinessMapping" as a link target.
The “structure view” for each language can be reset to default by using the “revert” feature next to the upload icon.
Customize structure view using MS VISIO
Download the VISIO template of the structure view
Open the file in MS VISIO and edit it according to your needs
Now, export a SVG file by clicking on "file" → "export" → "change file type" → "graphic file types - SVG Scalable Vector Graphics (*.svg)" → "save as".
Make sure that the font "Roboto" is installed on your computer, otherwise VISIO will use a different font for the exported SVG.The exported SVG file can be uploaded to LUY as is. There are, however, two optional steps that remove certain (possibly unwanted) visual effects.
Optional step 1: Remove the underline effect when hovering over building block types in certain browsers. For this, open the SVG in a text editor and add "g a:link {text-decoration: none;}" inside
the "<style>" tag.Optional step 2: Remove the tooltip, which is shown when hovering over the SVG. For this, open the SVG in a text editor and remove all "<title>" tags. Advanced text editors like “Notepad++” can easily remove all tags with only a few clicks. (In this case, bookmark all occurrences of "<title>", then delete all bookmarked lines.)
VISIO templates can be downloaded here:
Peek info
A “Peek info” box appears when hovering over a building block element and summarizes information about that element. Itcan be customized for each building block type, what information is to be displayed.
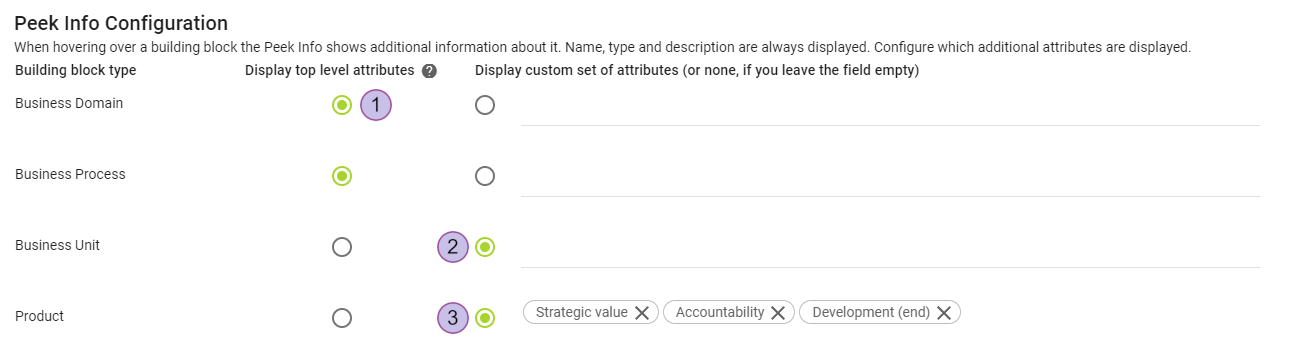
When "display top level attributes" is selected, the attributes from the top-level attribute group are displayed in the peek info box
Add custom attributes
Custom attributes are shown in the order they are selected from the input field
Corporate design
The following settings can be adjusted in the second tab of the “customization” tile.
Company logo and favicon
It is possible to change the LUY logo by uploading a new one. This logo will then replace the default one on the top left top corner of the application and on the login screen.
Whenever a new logo is uploaded, a new button will appear: "Get colors matching to the logo". The best matching colors will be picked from the new logo and presented.
LUY also allows customizing the favicon shown in browser tabs. The size of the uploaded icon must be 16x16, 24x24, 32x32, 48x48, 64x64, 128x128 or 256x256 and must not exceed 10 MB.
Colors
This section allows setting the primary, secondary and notification colors used in LUY. Selecting the color pallet icon will open a color picker. After selecting a new color, it will be applied automatically within the whole application:
Primary: This color is used to direct attention to something, e.g., buttons or active filters.
By default, this color is also set as the link color.Accent: This color is only used sparsely, e.g., for highlighting search results, active tabs, checkboxes, radio buttons.
Error: This color is used for errors, e.g., invalid input or internet problems.
Warning: This color is used for warnings, e.g., missing email addresses in surveys.
Success: This color is used to indicate success, e.g., successfully copying an element.
Info: This color is used for neutral information.
Header: This color is used for the header of the application. Please make sure that the primary and link colors are readable on top of this color.
Link: This color is used for links, except in diagrams. By default, the primary color is used, here.
Additionally, all customized colors can be reset by clicking "reset all colors to default".
Colors for the start screen
The colors for the start screen menu tiles are customizable. The first row of tiles represents the data tab tiles on the start screen. Clicking on the tile will open a color picker for choosing a new color. In the second row, the tiles' colors in diagrams, reports and in the administration menu can be changed.
All customized colors can be reset by clicking "reset all colors to default".
Color schemes for diagrams
Numeric attributes have certain colors in diagrams according to their value. These color schemes can be added/edited/deleted within the "color schemes for diagrams" section.
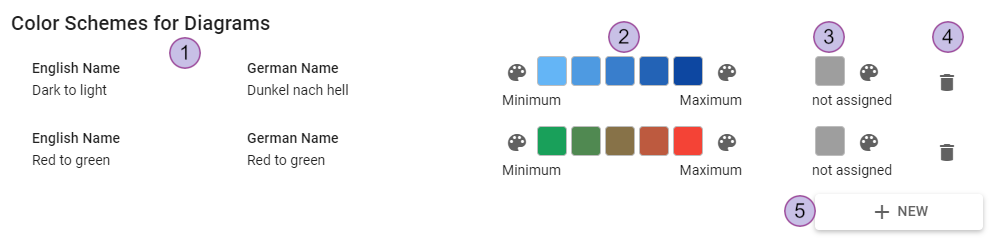
Name(s) of the color schemes
Names can be edited by hovering over the name and clicking on the pencil icon.Color schemes are configured by setting both a min and a max value
The gradient colors in between are calculated automatically.The color for undefined values is set separately
Delete color scheme
Add new color scheme
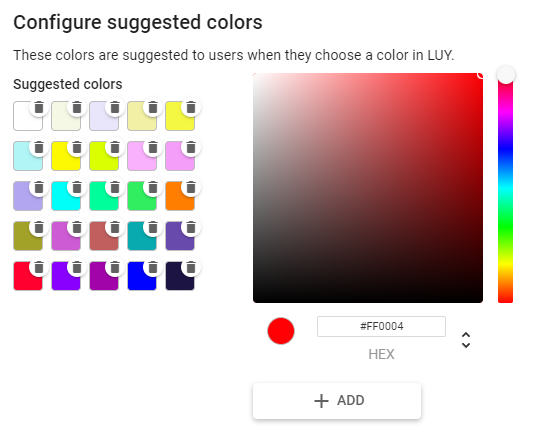
Configure suggested colors
This section allows configuring suggested colors, which will be used in color pickers across the whole application. All colors are sorted by their brightness value.
Start page configuration
The following settings can be adjusted in the third tab of the “customization” tile.
Announcement
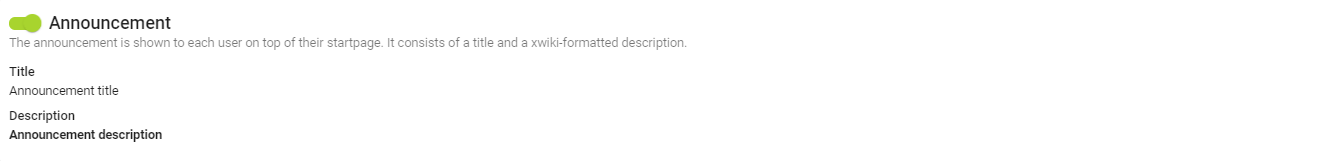
The announcement customization section allows displaying additional information on the start page for every logged-in user. This announcement can display links to other pages, list guidelines on how to use LUY and much more. It's possible to disable the announcement overall via the toggle button. It is disabled by default.
The title contains a maximum of 255 characters. The description contains a maximum of 4000 characters and has xWiki formatting.
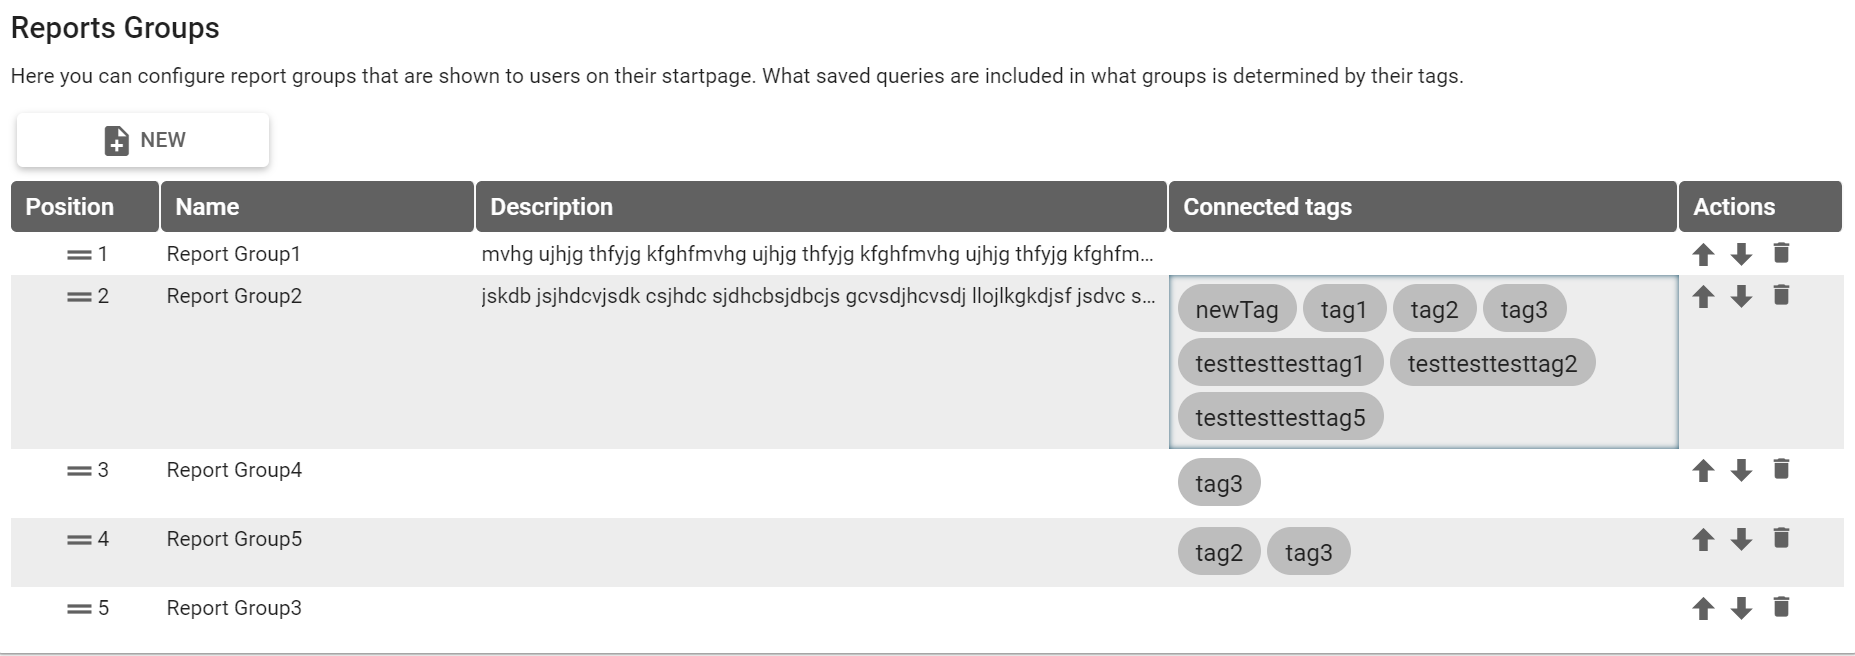
Report groups
Report groups can be used to display important reports directly on the user's start page. Tags determine which reports are included in which report groups.
A report group without tags is not displayed. The same applies for reports, connected by tags to report groups, which do not exist anymore.