Landscape diagram
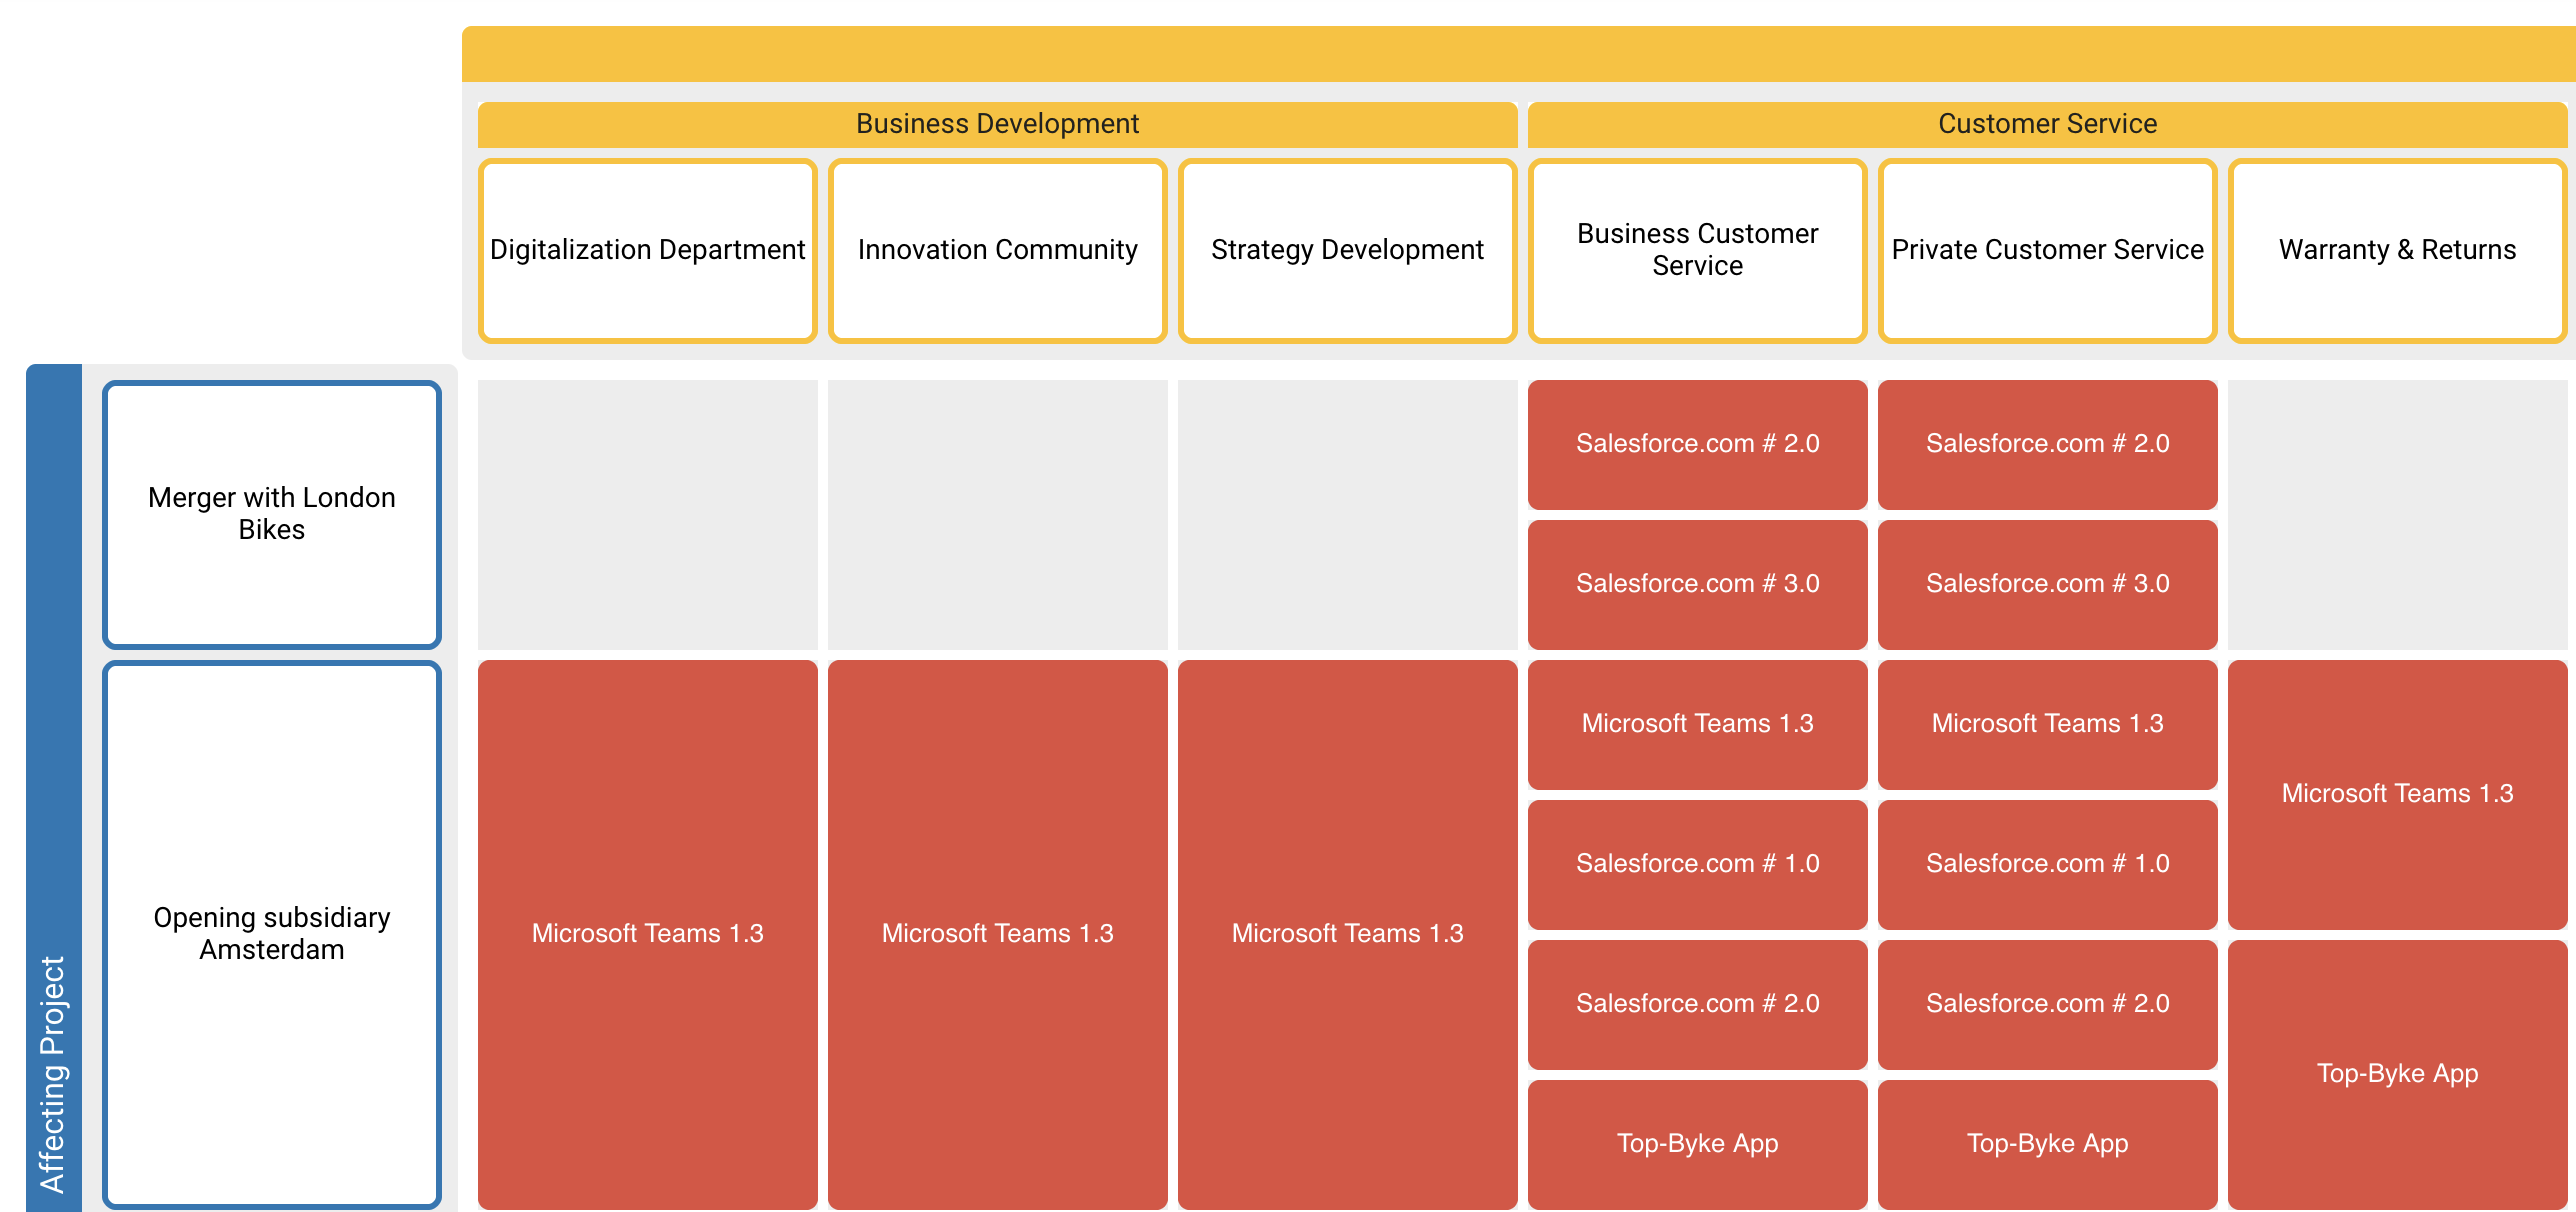
Visualize building blocks in a matrix-like structure based on their relations and attributes using the landscape diagram. This visualization allows specifying a building block type to show as content in the center, and then choose relations or attributes for the columns and rows. This way even complex relationships can be displayed in an easy to comprehend visualization.
Example use case
You want to see which data is processed by which information systems within the organization’s business processes.
Configuring content, columns and rows
Start by selecting a building block type for the content, displayed in the center of the diagram. Based on the content type, columns and rows can be configured by choosing either relations, self-relations or attributes (only enumeration, responsibility and boolean are supported) which are connected to the selected content type. The diagram will then display a matrix-like visualization, showing the content’s building blocks in the appropriate columns and rows.
Customize the visualization of content, columns, and rows by filtering, sorting, coloring and line-type (only for content).
Setting filters for relations
The configuration tab "filter for relations", allows to configure filters for the relations between content type and column and row types. Certain relations can be excluded, thereby the displayed information is reduced. This is particularly useful when the relation between content and column or row is expressed through a business mapping, since business mappings can have attributes attached to them – which can then be filtered by.
Additional display options
Hierarchy structure (for columns and rows) → Use this setting to visualize building blocks in their hierarchy. If turned off, all building blocks will be displayed next to each other (flat), regardless of their hierarchical structure.
Aggregate hierarchy level → Use this setting to display certain levels of the hierarchy while still considering the relations of the hidden levels in the diagram.
Orphaned elements → By default, content elements that are not connected to both axes (columns and rows) are hidden. Use this setting to display those elements.
Empty column and rows → By default, elements on the columns or rows axis are hidden if they do not have any corresponding elements in the content of the diagram. Use this setting to display those empty columns or rows.
Hierarchical names → Use this setting to display hierarchical building block names (the name of the parent element, if any, will be displayed too).