Masterplan diagram
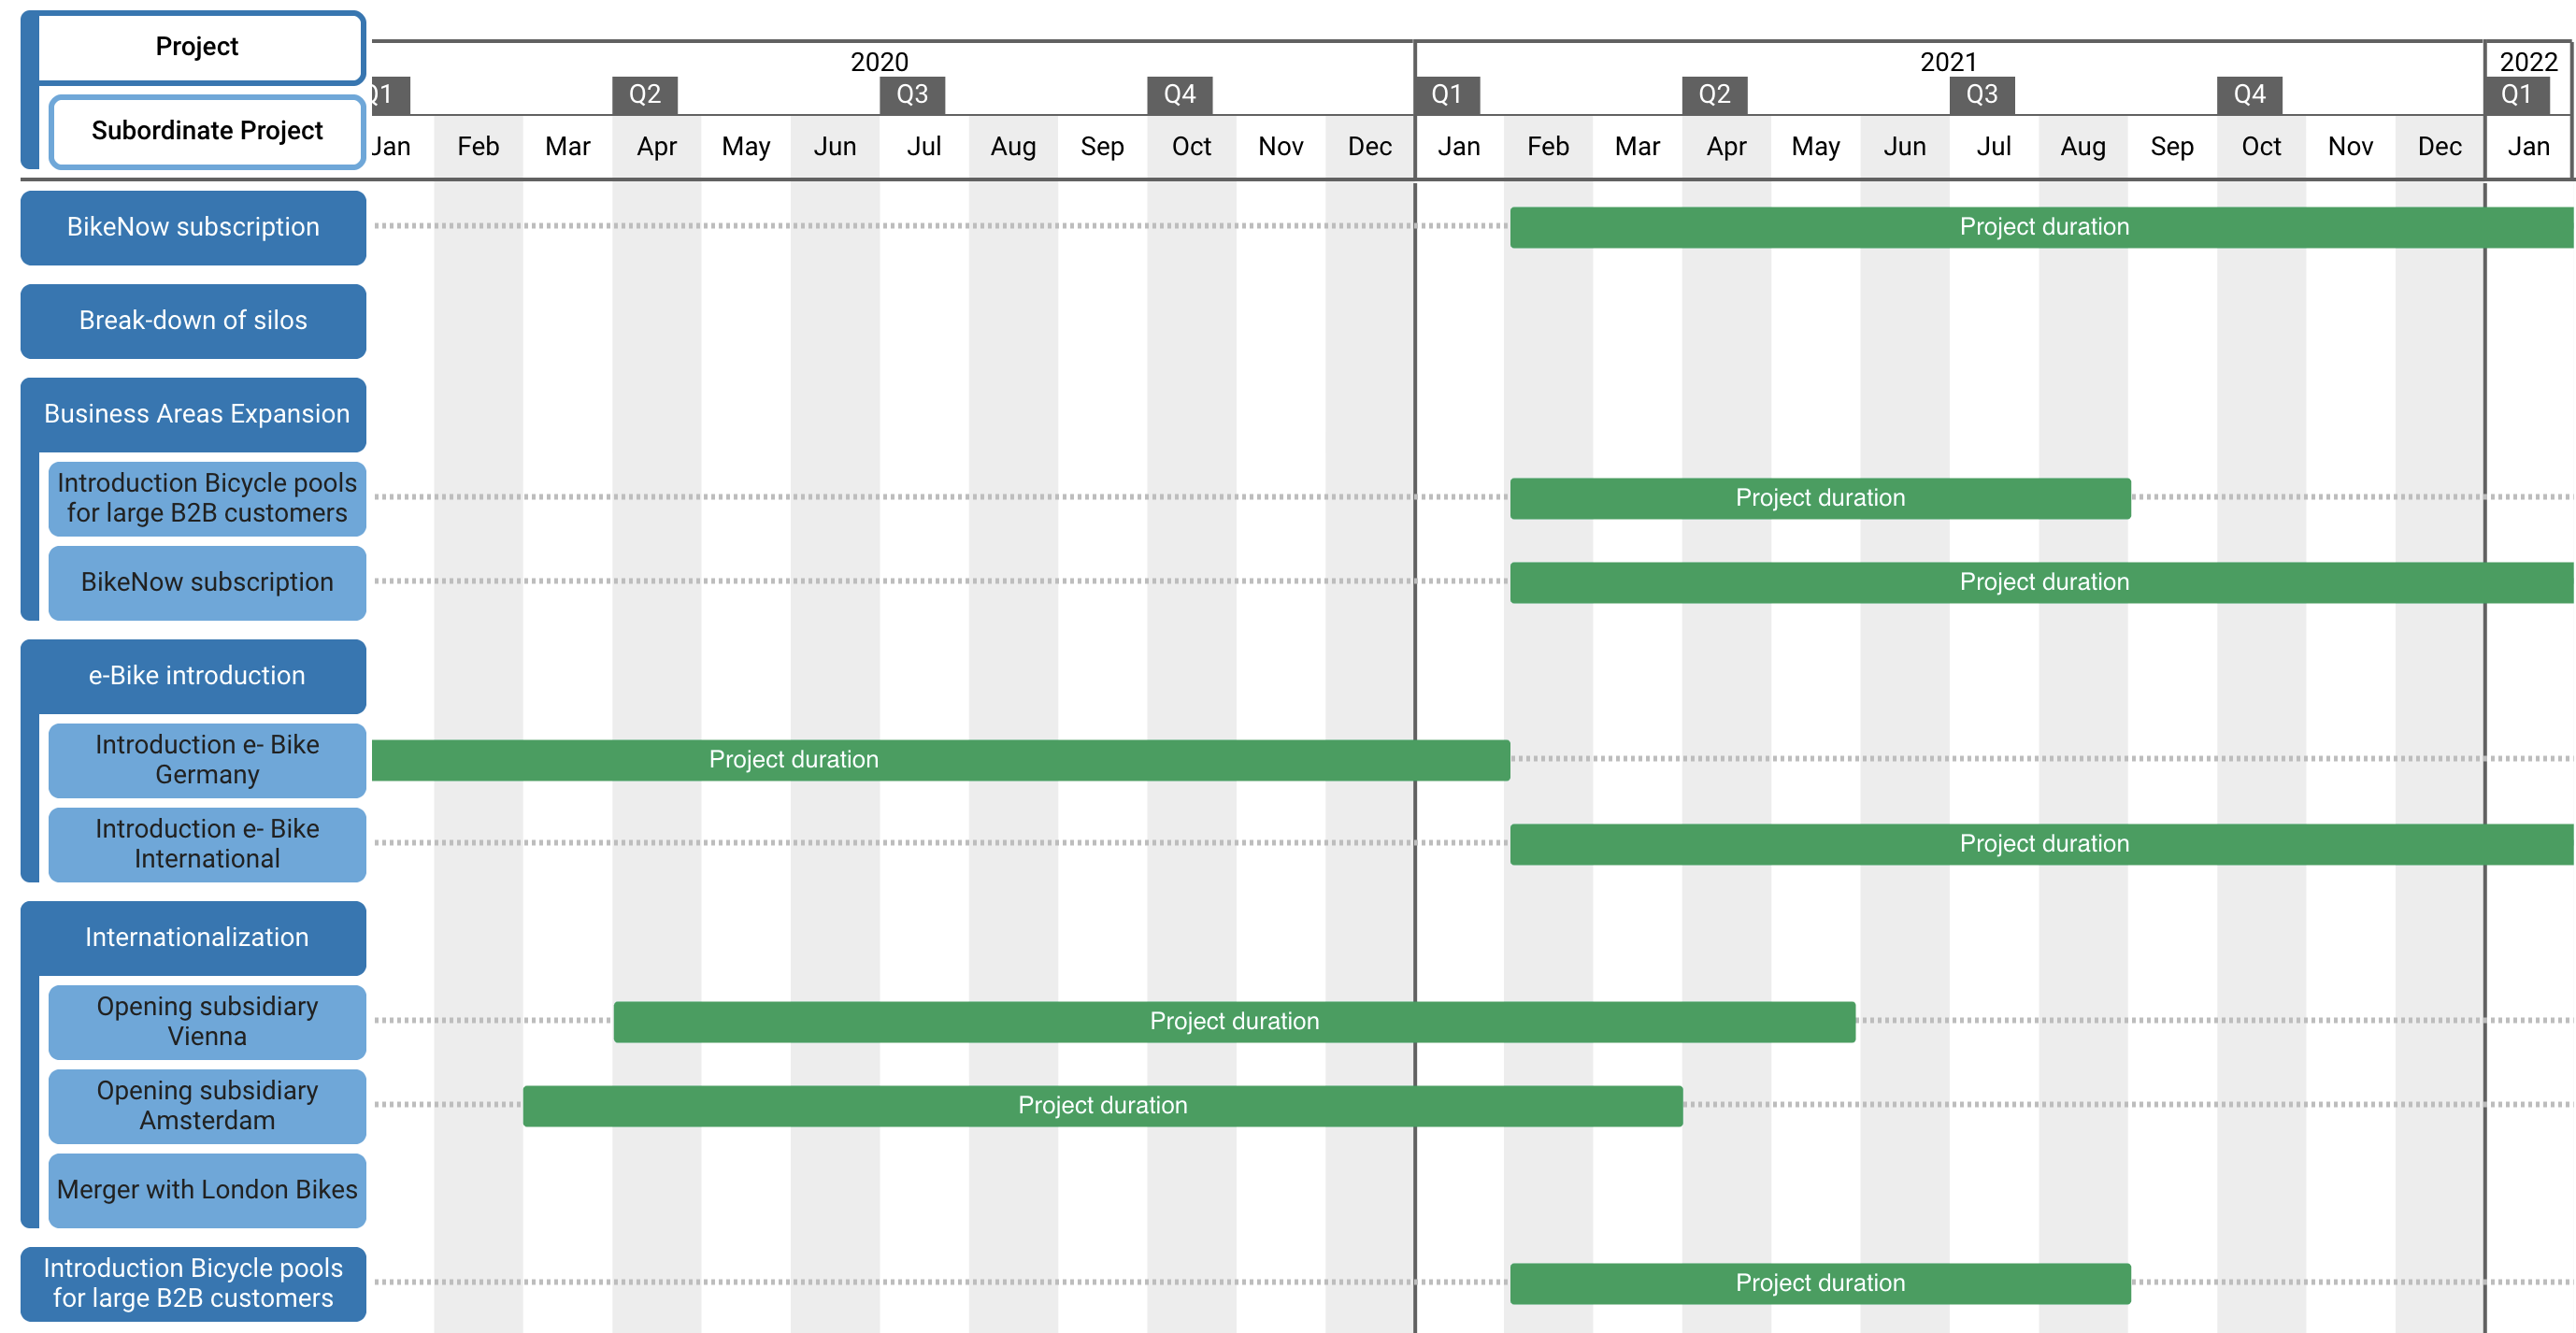
Visualize date intervals as bars, similar to a Gantt chart in a project context, by using the masterplan diagram. It allows you to display date intervals attached to building block types in a calendar view and examine them in relation to each other.
Example use case
Overview of rollout, decommissioning and replacement dates for information systems.
Furthermore, up to three different related building block types can be displayed as levels. Filtering and coloring is possible for any building block type on any level. Additionally, any attribute or relation can be added as an additional column to the view.
Configuring up to three levels
Start by selecting a building block type for the first level. Next, select one or more date intervals attached to this building block type (only if the type has date intervals) to display them in the diagram.
Add up to three different building block types as levels. Level two is subordinated to level one, and level three is subordinated to level two. The types chosen for level two and three depend on what was chosen for the prior level – there needs to be a direct relation (or connection via business mapping) to the superordinate level.
The visualization of each level can be customized by applying filters, sorting, and coloring.
Adding additional columns
In the masterplan diagram, additional columns can be added to each level. These additional columns may be used to display relevant attribute values for each building block within the visualization. If the selected attribute applies to multiple levels, the attribute values of each applicable level are shown. Those additional columns can be removed by re-selecting them in the toolbar dropdown.
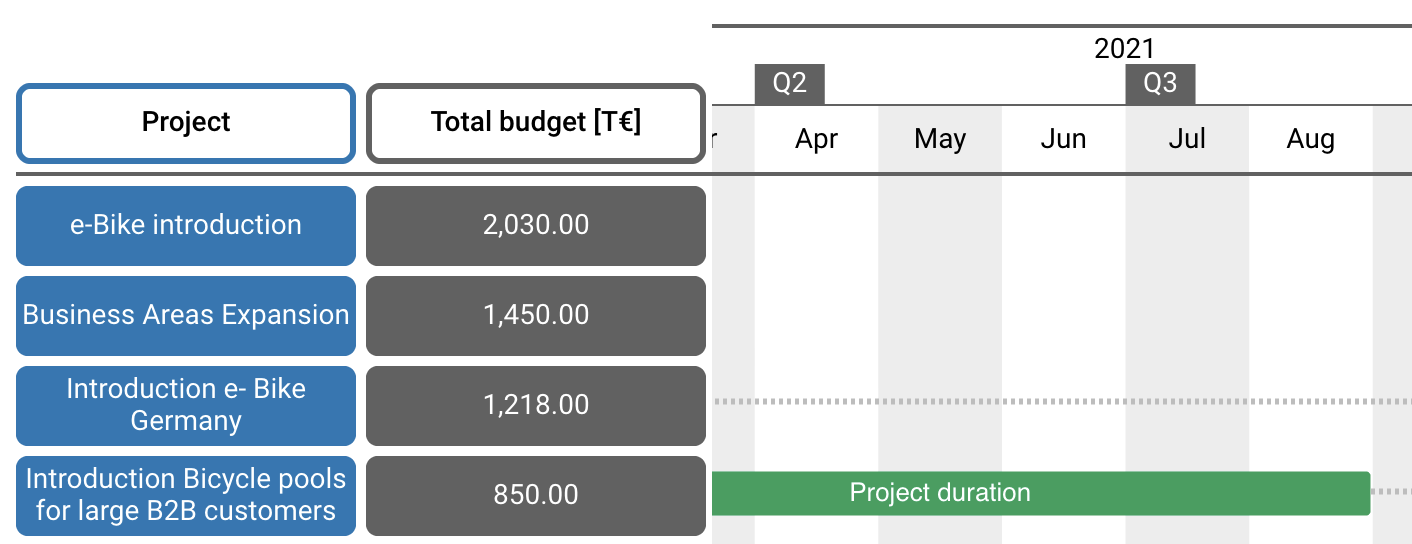
It is possible to add additional columns with important contextual information.
Customize date range and time-units
The diagram can be customized to include a certain date interval by specifying a start and end date using the “date range” button. Furthermore, time-units can be displayed on top of the diagram by clicking on “month” (depending on the current configuration for time-unit) and adjusting any other available option (day/week/month/quarter/year).
Additional display options
Hierarchical names: Use this setting to display hierarchical building block names (the name of the parent element, if any, will be displayed too).
Today label: Enable this setting to include a vertical separator and label indicating the current day within the calendar view.