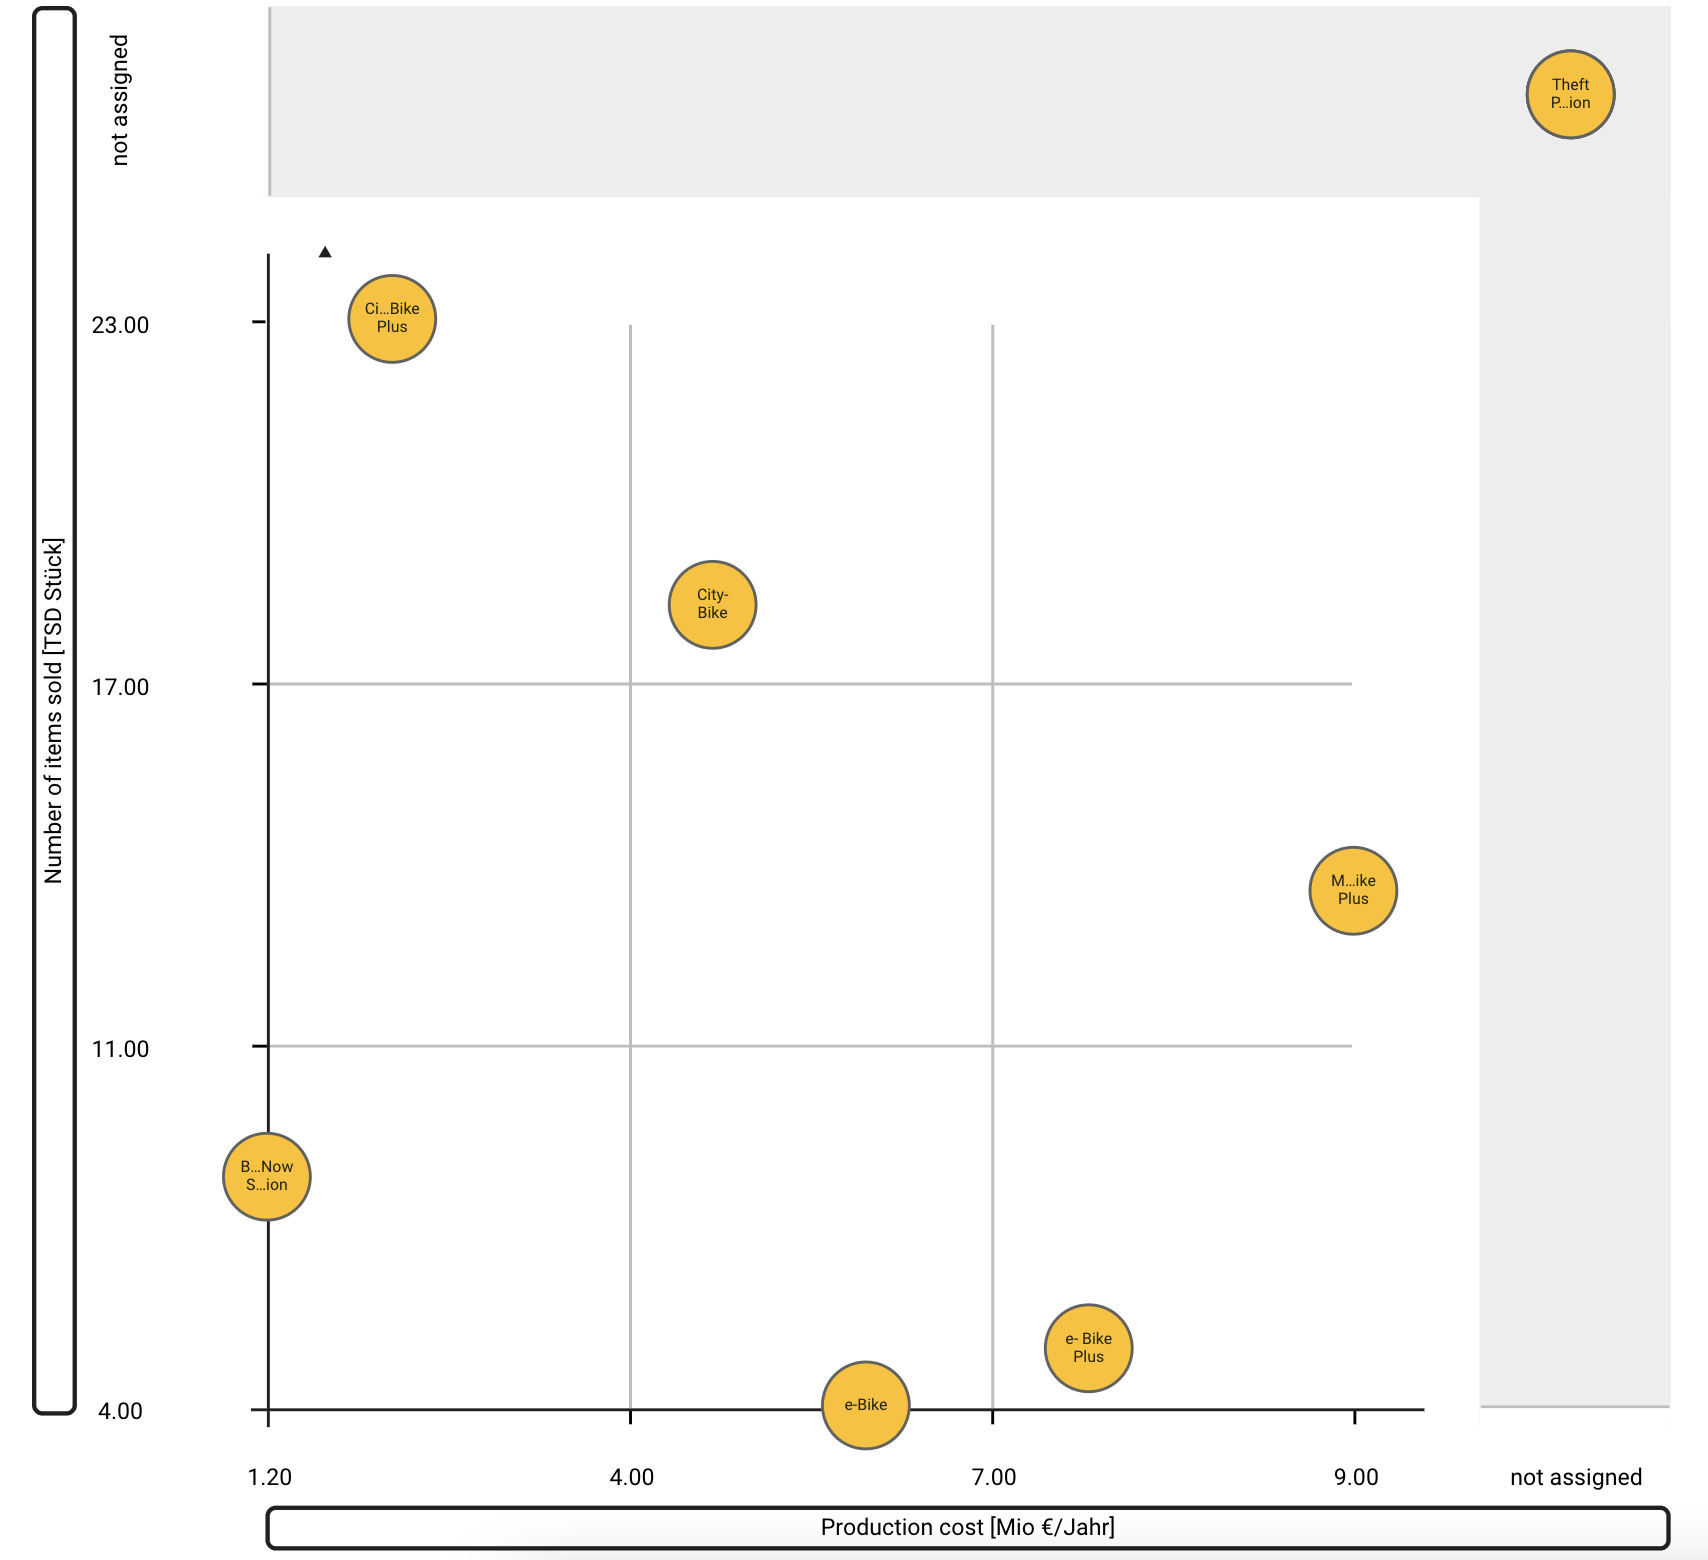
Portfolio diagram
Visualize building blocks' distribution along two axes using the portfolio diagram. It allows you to compare building blocks according to certain attribute values and understand the overall distribution within a building block type.
Example use case
You want to compare different purchasing alternatives for a new e-commerce solution along a multitude of factors: meeting of requirements, project duration, and project costs.
Configuring building block type, x-axis and y-axis
Start by choosing a building block type, as well as two attributes for the x- and y-axis. The diagram then visualizes the elements of this building block type as circles, positioned along both axes according to their attribute values.
Using the size dropdown, select an attribute to control the circle diameter of each element.
Customize the diagram by applying filtering, sorting, and coloring.
Additional display options
Hierarchical names: Use this setting to display hierarchical building block names (the name of the parent element, if any, will be displayed too).
Cropping activated: Use this setting to hide empty rows and columns. In the case of a numeric attribute on an axis, the empty rows or columns at the upper limit are cropped. In the case of an enumeration attribute on an axis, any empty column or row is cropped.