Information flow diagram
Visualize the way data flows between applications by using the information flow diagram. This visualization provides the option to display information systems, the way they are connected via information flows, and the kind of business objects that are exchanged in the process. You can include all kinds of relevant relations using annotations.
Example use case
Visualize which entities business objects and information systems are exchanging.
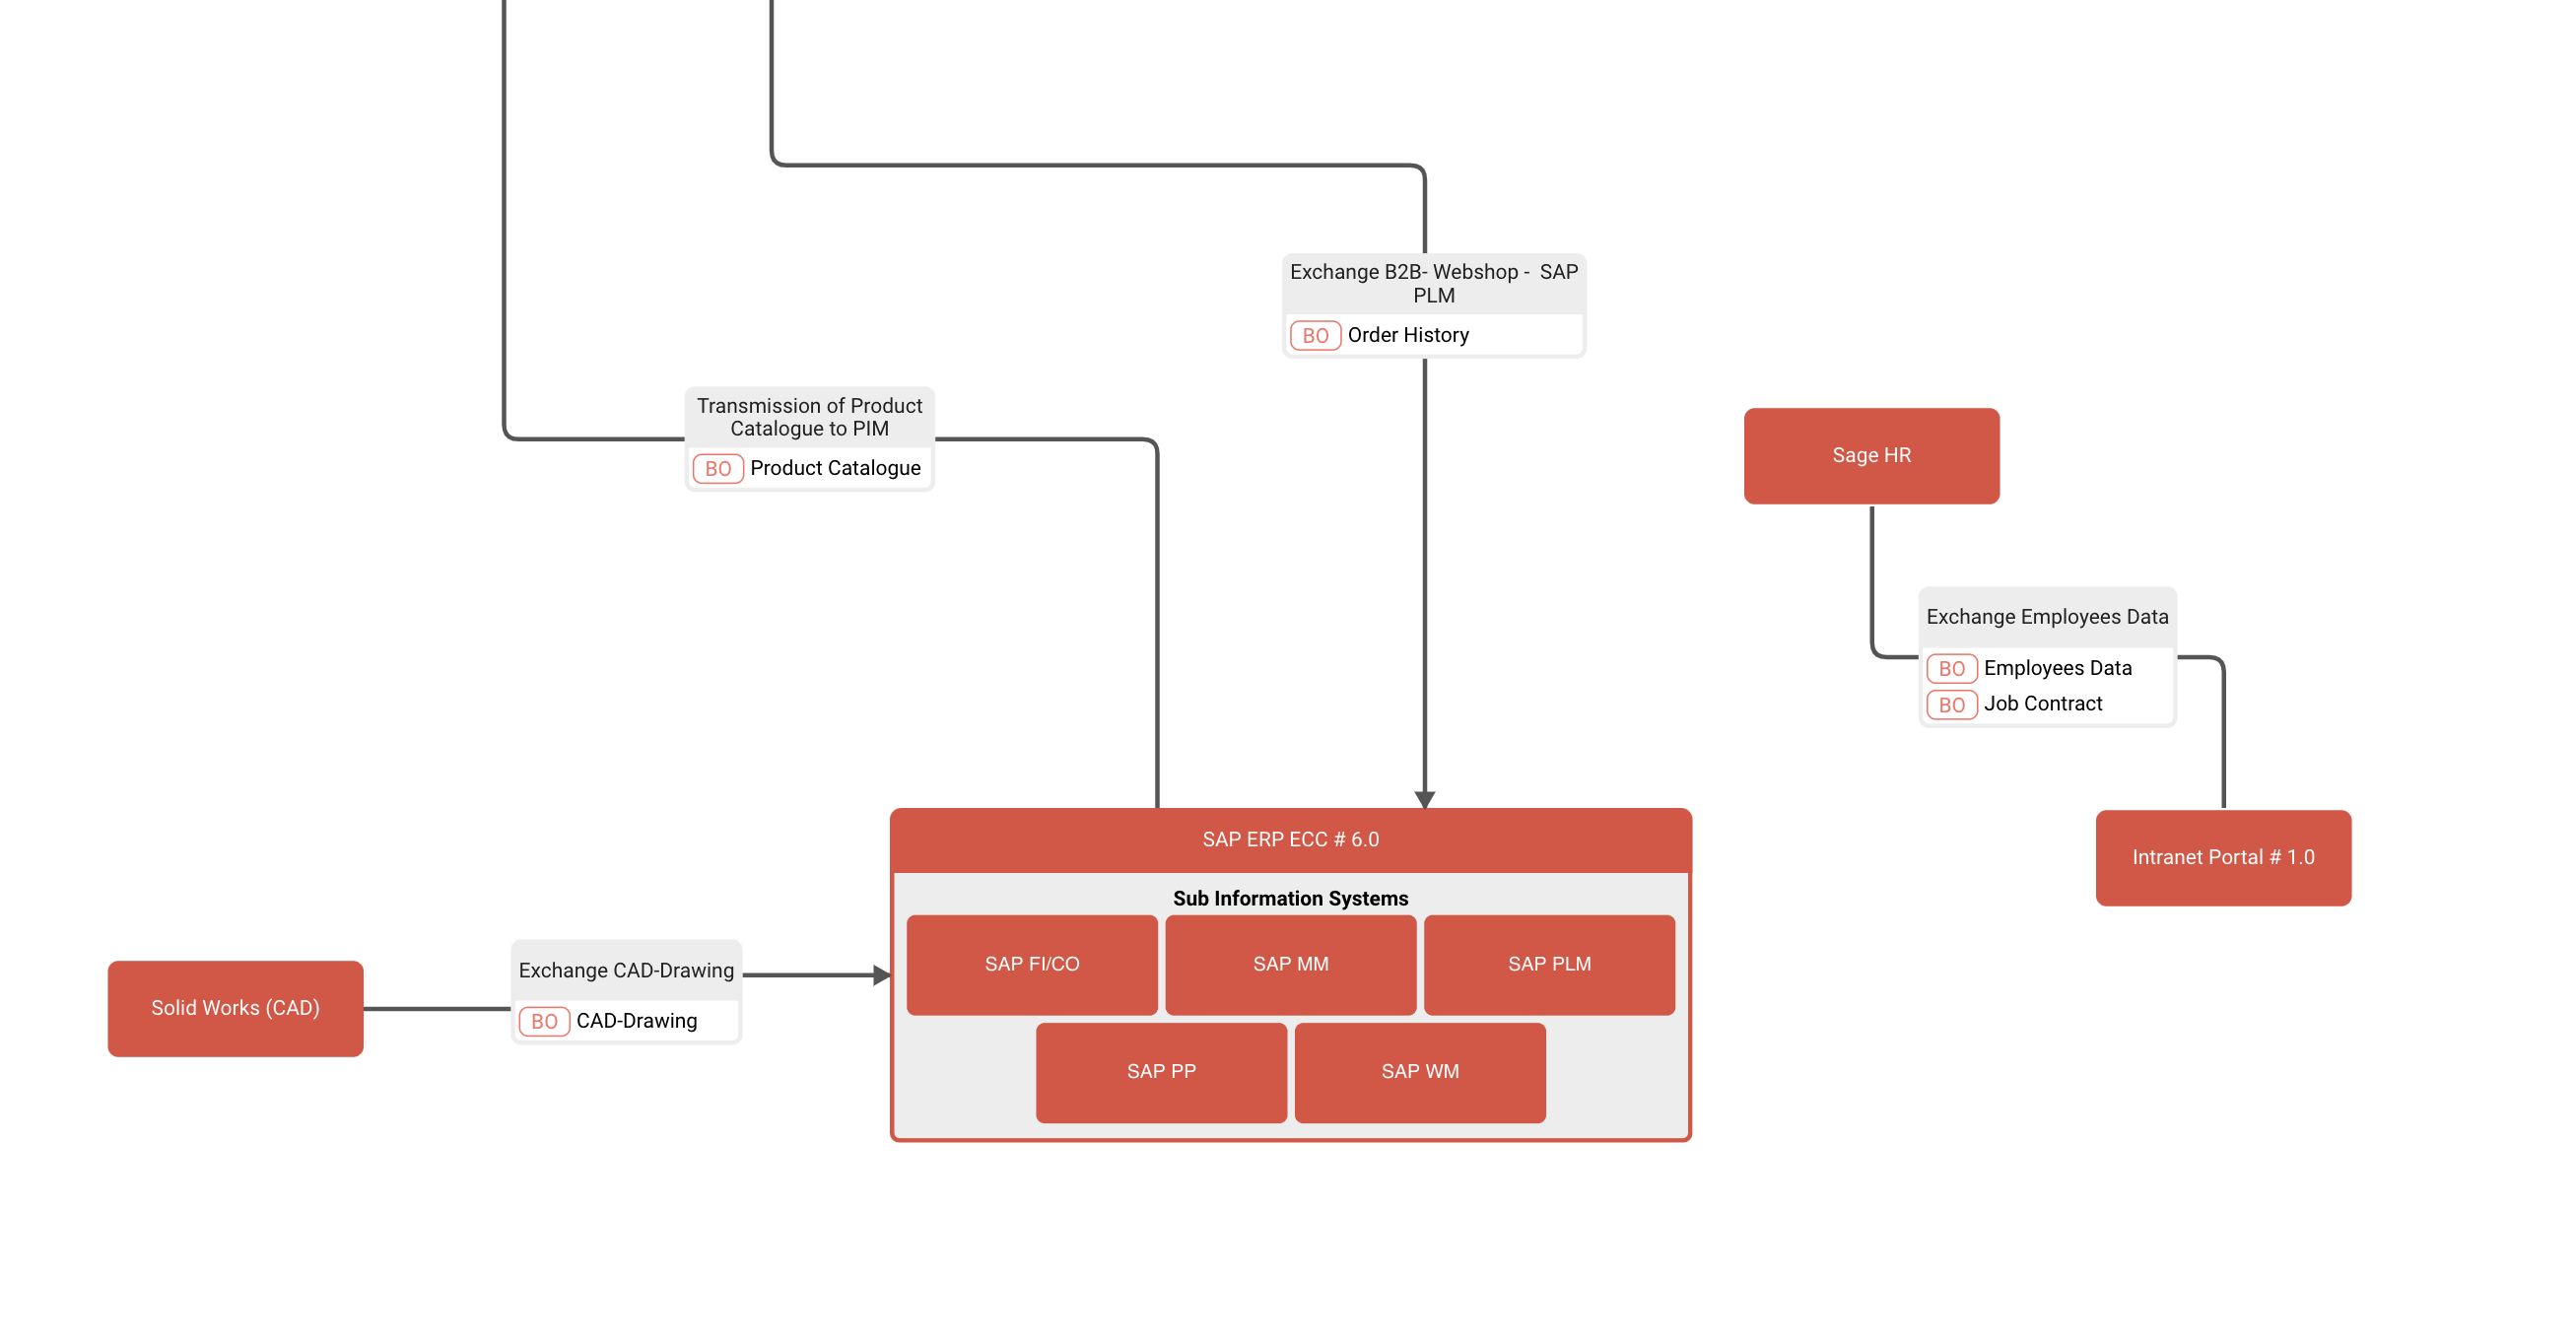
By default, the information flow diagram displays all information systems as diagram nodes and the information flow as diagram edges connecting the nodes. The "information flow direction" attribute attached to information flow determines if the diagram edge has an arrow in one direction, both directions, or if it doesn’t have any arrow at all.
Filtering nodes and edges
Filtering can be used for nodes (information systems) as well as edges (information flows). This allows restricting which building blocks are represented within the diagram. "Include information systems connected over information flows" is a special filtering functionality for the node filter and allows to include additional information systems that are connected via information flows to the set of elements determined by the filter. These additional elements are also shown in the manual selection part of the filter, where they can be included or excluded.
Customizing the layout
The layout can be customized by drag-and-dropping the displayed elements. This way, it is possible to change the positions of nodes, edges, and edge annotations. With the horizontal and vertical spacing options in the "layout" section of the diagram toolbar elements can be automatically distributed along the horizontal and vertical axis.
Edge annotations can be moved and rotated by left clicking and dragging the rotation handle.
With a left click on edges, the line of the displayed drag handles can be adjusted. These drag handles allow modifying where the edge is going and introducing new points to an edge. Drag-and-dropping the point connecting an edge to a node can change where the edge docks onto the node, called a port. Dragging the outermost point of an edge to the center of the connected node reverts to the default port.
Left clicking any edge and selecting "reset edge" restores the original line; right clicking any additionally introduced edge point removes it individually.
Reset all customized positions by using the "reset positions" button in the diagram toolbar.
Adding and filtering annotations
Add additional information to the diagram by adding annotations to nodes and edges. Annotations display relations to other building blocks; for instance, business objects can be added to edges, thereby displaying which business objects are transported via that information flow. Annotations to edges are displayed in a separate box which is displayed on top of the edge, whereas node annotations show up as boxes within the nodes themselves.
Annotations can be filtered for selected nodes and edges. Only the resulting annotations are displayed in the diagram.
The setting "hide annotations" in the “display" section of the diagram toolbar quickly toggles between showing and hiding both node and edge annotations.
Visualizing attributes on nodes and edges
Coloring of nodes can be changed using the "color by" setting in the diagram toolbar, similar to the way coloring works in other diagrams.
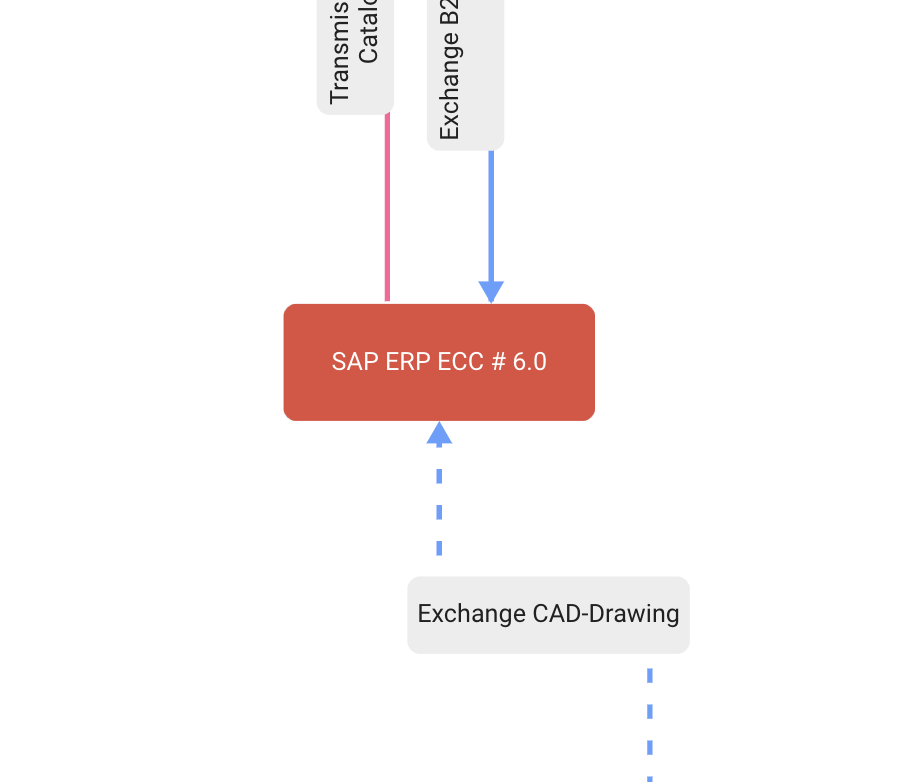
For edges, the "edge line type" setting in the diagram toolbar can be used to color edges as well as change edge line types according to the selected attributes. Up to two different attributes for each information flow can be visualized.
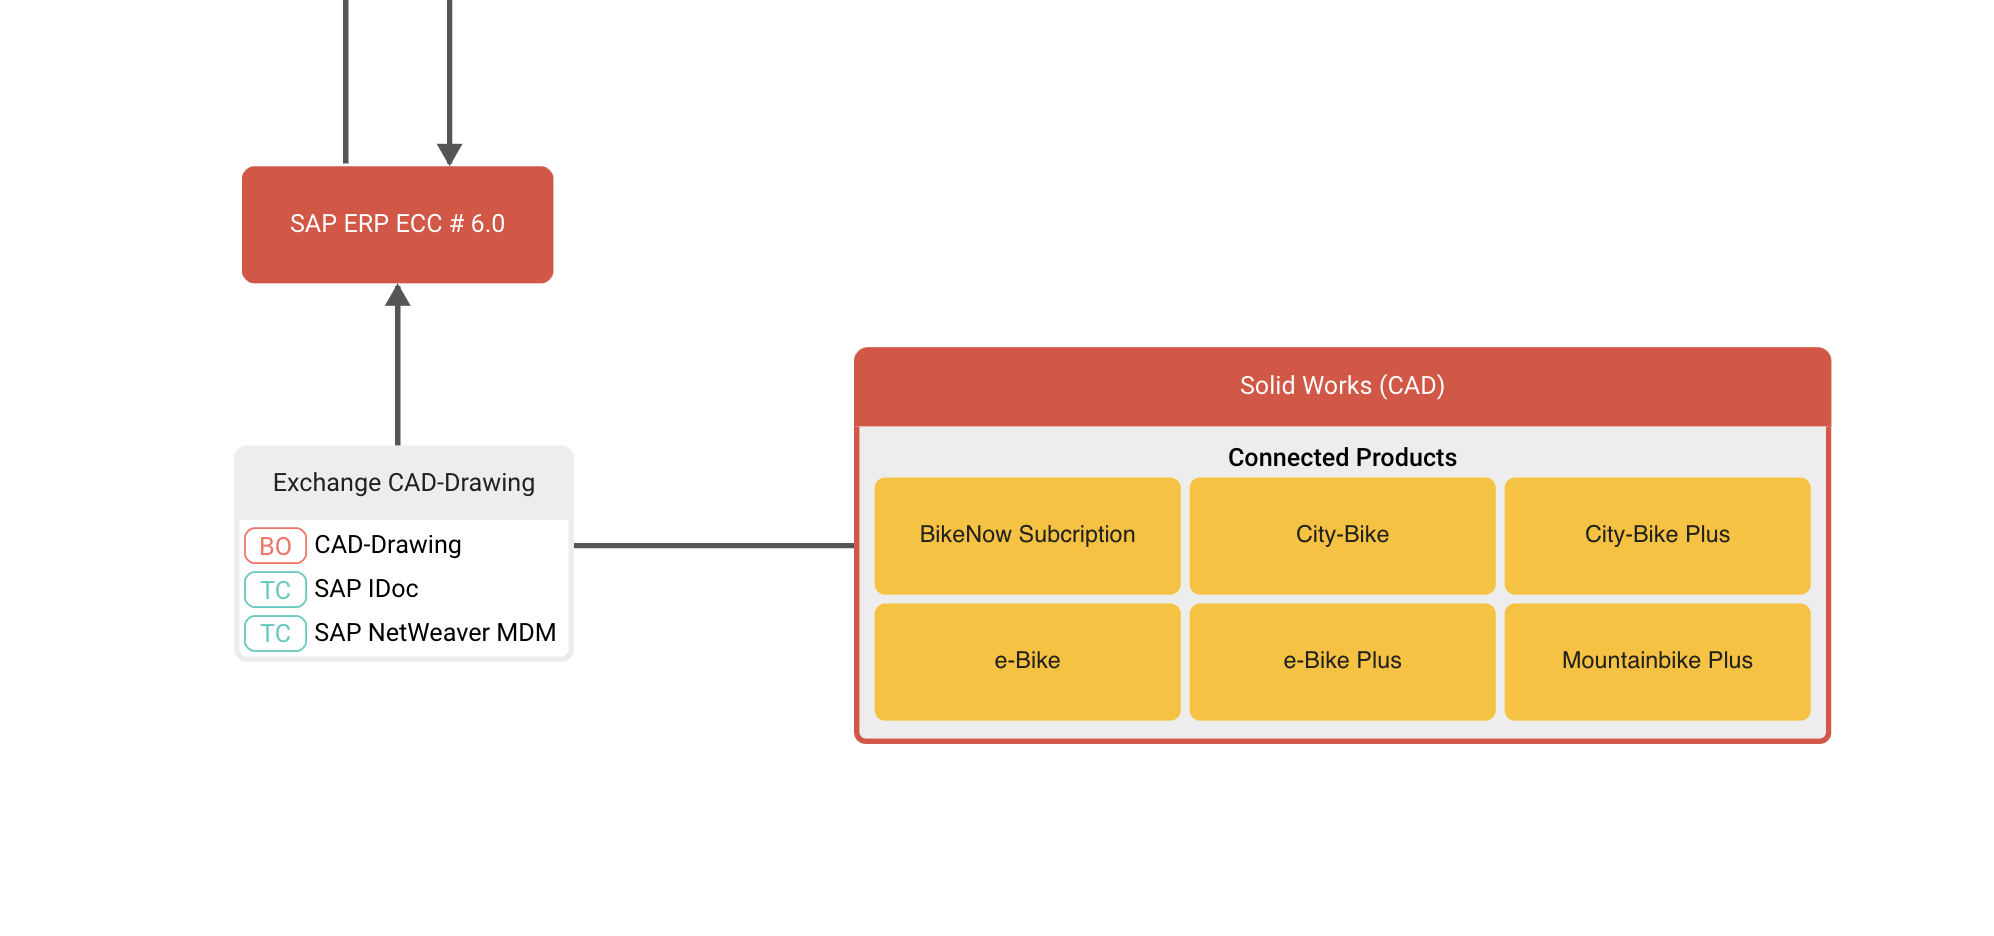
Display options for sub information systems
By default, sub information systems (information systems that are subordinate in the hierarchy of building blocks) are displayed nested within their parent elements and all edges connected to them are connected to their parent instead (aggregated). This can be changed by choosing a different option in the "display" settings of the diagram toolbar:
Display Option | Description |
|---|---|
Nested & edges aggregated (default) | Shows all sub information systems within the node of the parent element, and all edges uniformly as edges of the parent element. |
Nested & edges not aggregated | Shows all sub information systems within the node of the parent element, and edges that connect to sub information systems connect to those nodes within the parent element. |
Nested & edges aggregated (hide descendants) | Displays all sub information systems within the node of the parent element and all edges uniformly as edges of the parent element, but also hides all sub information systems. |
As separate nodes | Shows all information systems as separate nodes. |
As separate nodes (hide descendants) | Displays only the parent elements (highest nodes in hierarchy) and the parent element edges, not the sub information systems and their edges. |
Additional settings
Hierarchical names: This setting can be used to display hierarchical building block names (the name of the parent element, if any, will be displayed too).
Element highlighting: When nodes are selected, those nodes and all nodes directly connected via edges will be highlighted. Multiple nodes can be selected and highlighted by pressing CTRL. Highlighting cannot be exported in PDF or Visio documents. Use SVG or image exports to get highlighted elements in downloaded files.