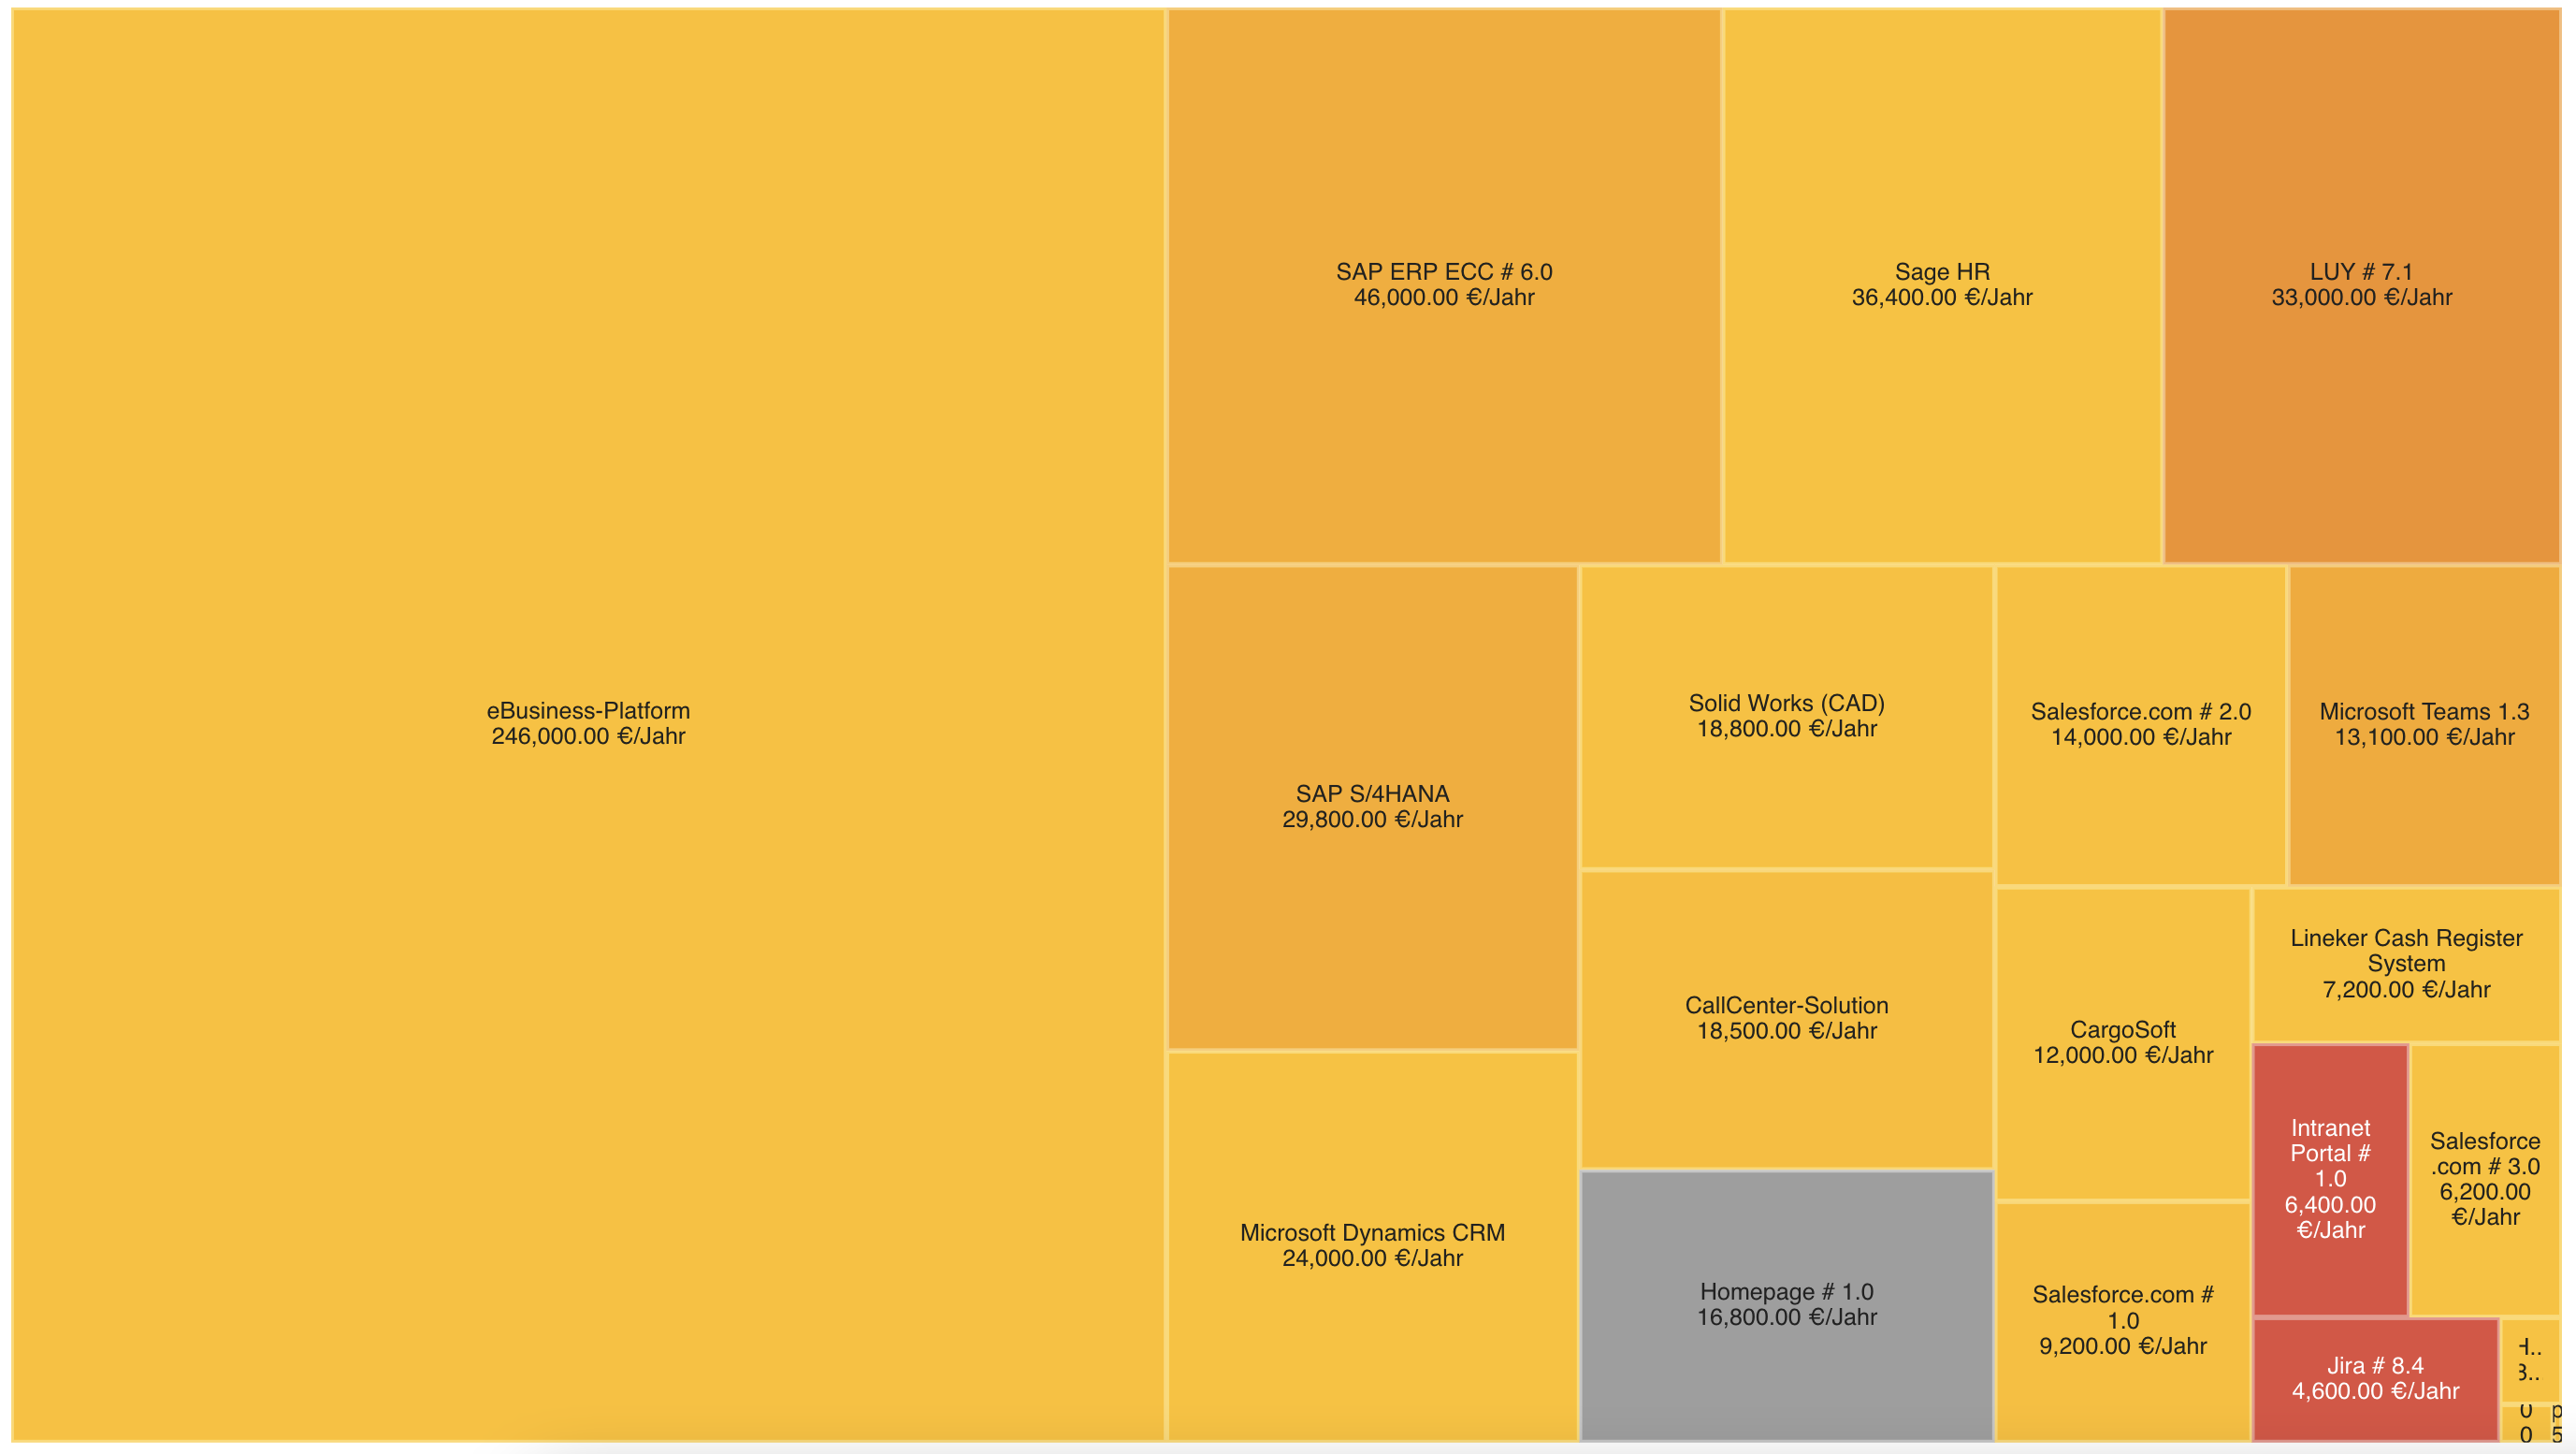
Tree map diagram
Visualize and compare the quantities of attribute values within a given building block type with the tree map diagram. This diagram allows a quick overview of the distribution of quantities through the size of the boxes, together with an optional second attribute.
Example use case
You want to see the information systems with the highest annual license costs, together with the number of active users in an organization.
Configure building block type and attribute
Start by choosing the building block type and attribute of interest. The diagram visualizes the elements within that building block type as boxes, with the box size according to the assigned attribute value.
Customize the diagram by applying filters and coloring.
Additional display options
Hierarchical names: Use this setting to display hierarchical building block names (the name of the parent element, if any, will be displayed, too).