Open and view pie chart diagrams in our new frontend
October 2023
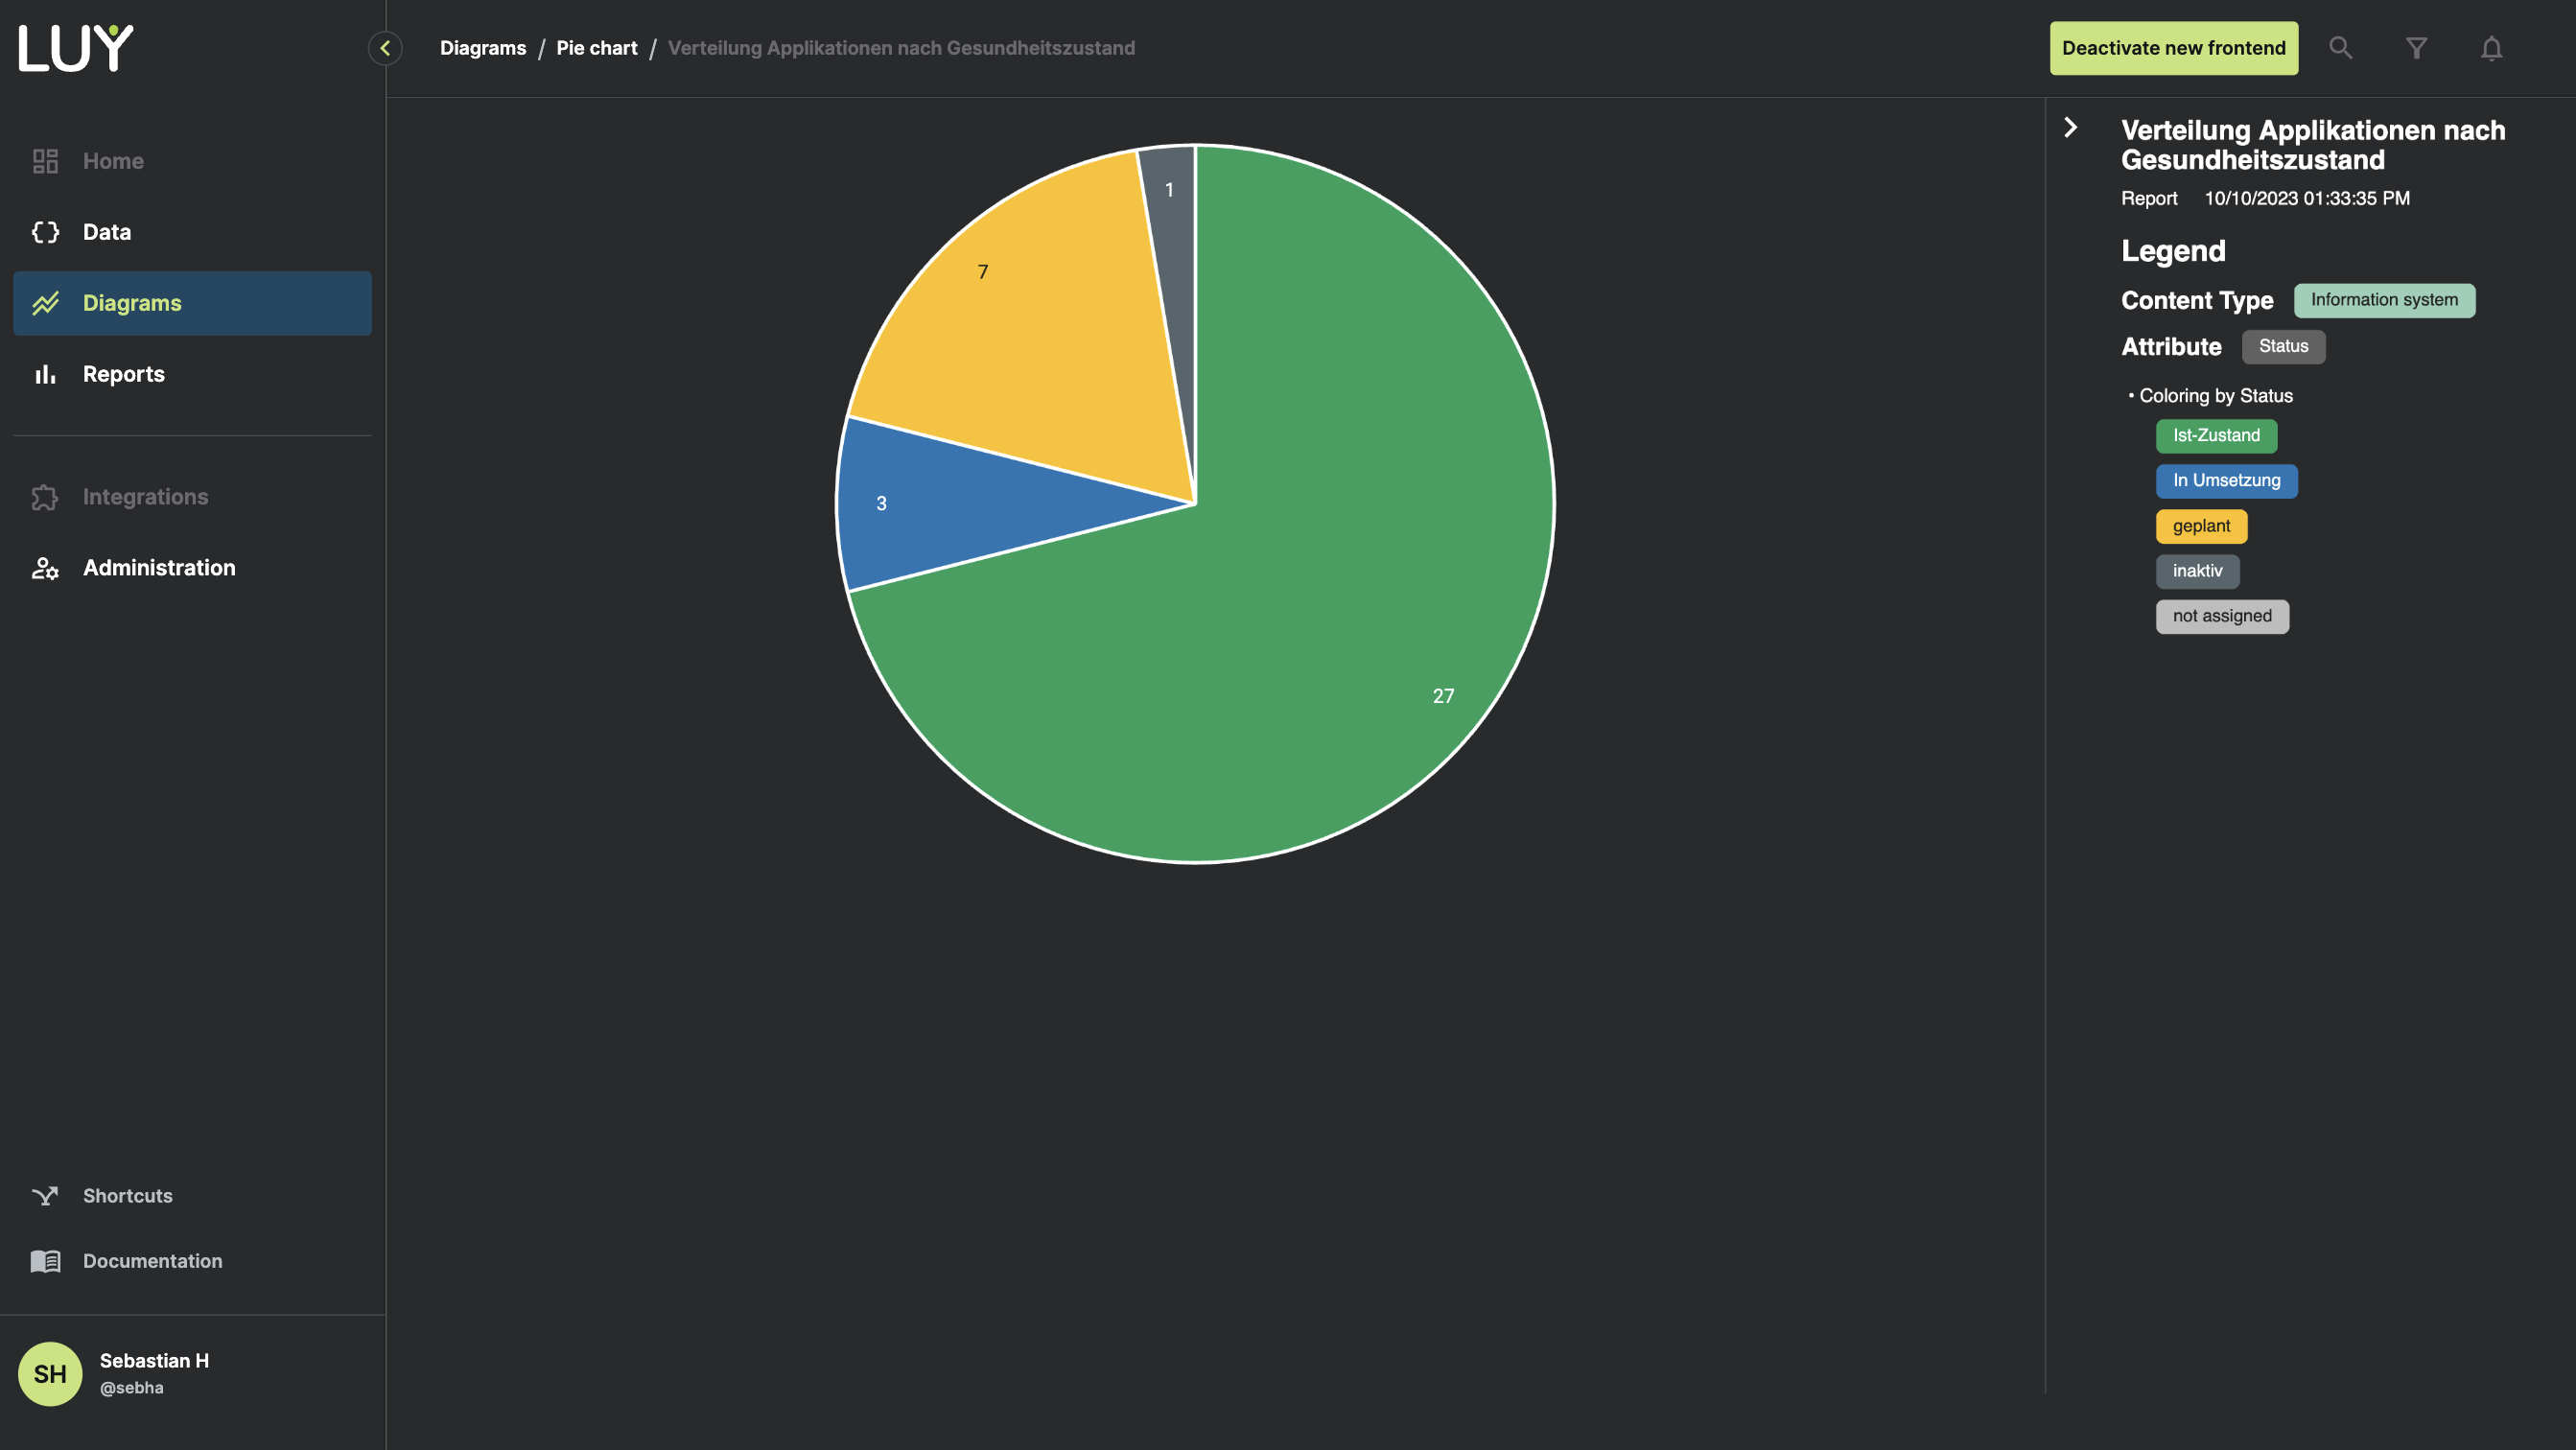
Visualize the distribution of attribute values within a certain building block type. This diagram displays a classical pie chart, with slices proportional to the quantity of building blocks that share the same attribute value. For our new frontend we’ve added some improvements like the ability to also use dark mode to view diagrams.
A full description of this diagram type can be found here: Pie chart diagram.
For this version, the pie chart diagram is in read only mode. You are able to open and view reports but can’t edit them yet.
Open diagram
Pie chart diagram reports can be opened either via the open diagram overlay or the reports page.
Open diagram overlay
The overlay shows a table of all pie chart diagram reports available to you. These are either your own reports or reports which have been shared with you by other users.
In the dialogue you can see additional information like the author of the report as well as the last modified timestamp for each report.
If there is a long list of reports, use the filter option to search for specific reports by name.
There are two ways to open this overlay list:
Click on the pie chart diagram tile in diagrams.
When a pie chart report is already open, by clicking on the pie chart text in the breadcrumb
All reports page
It is also possible to open a pie chart diagram report via the reports page: Just click on the name of the report to open it.
Tip: The reports page allows you to filter not only by name but also by all other attributes of a report. E.g., it is possible to only show PCD-reports by filtering for “pie chart” or only show reports with certain tags by filtering for the tag name.
Navigate diagram
By clicking and holding your left mouse button you can move the diagram content.
Clicking CTRL while scrolling will zoom in and zoom out.
Limitations
Be aware that for this first iteration our new frontend does not yet support every feature known to you in our previous LUY solution. These features will follow shortly.
It’s not possible to edit a pie chart diagram.
High contrast mode isn’t supported completely.
Some filters configurations aren’t support yet (e.g., filters for the version attribute).