Cluster diagram
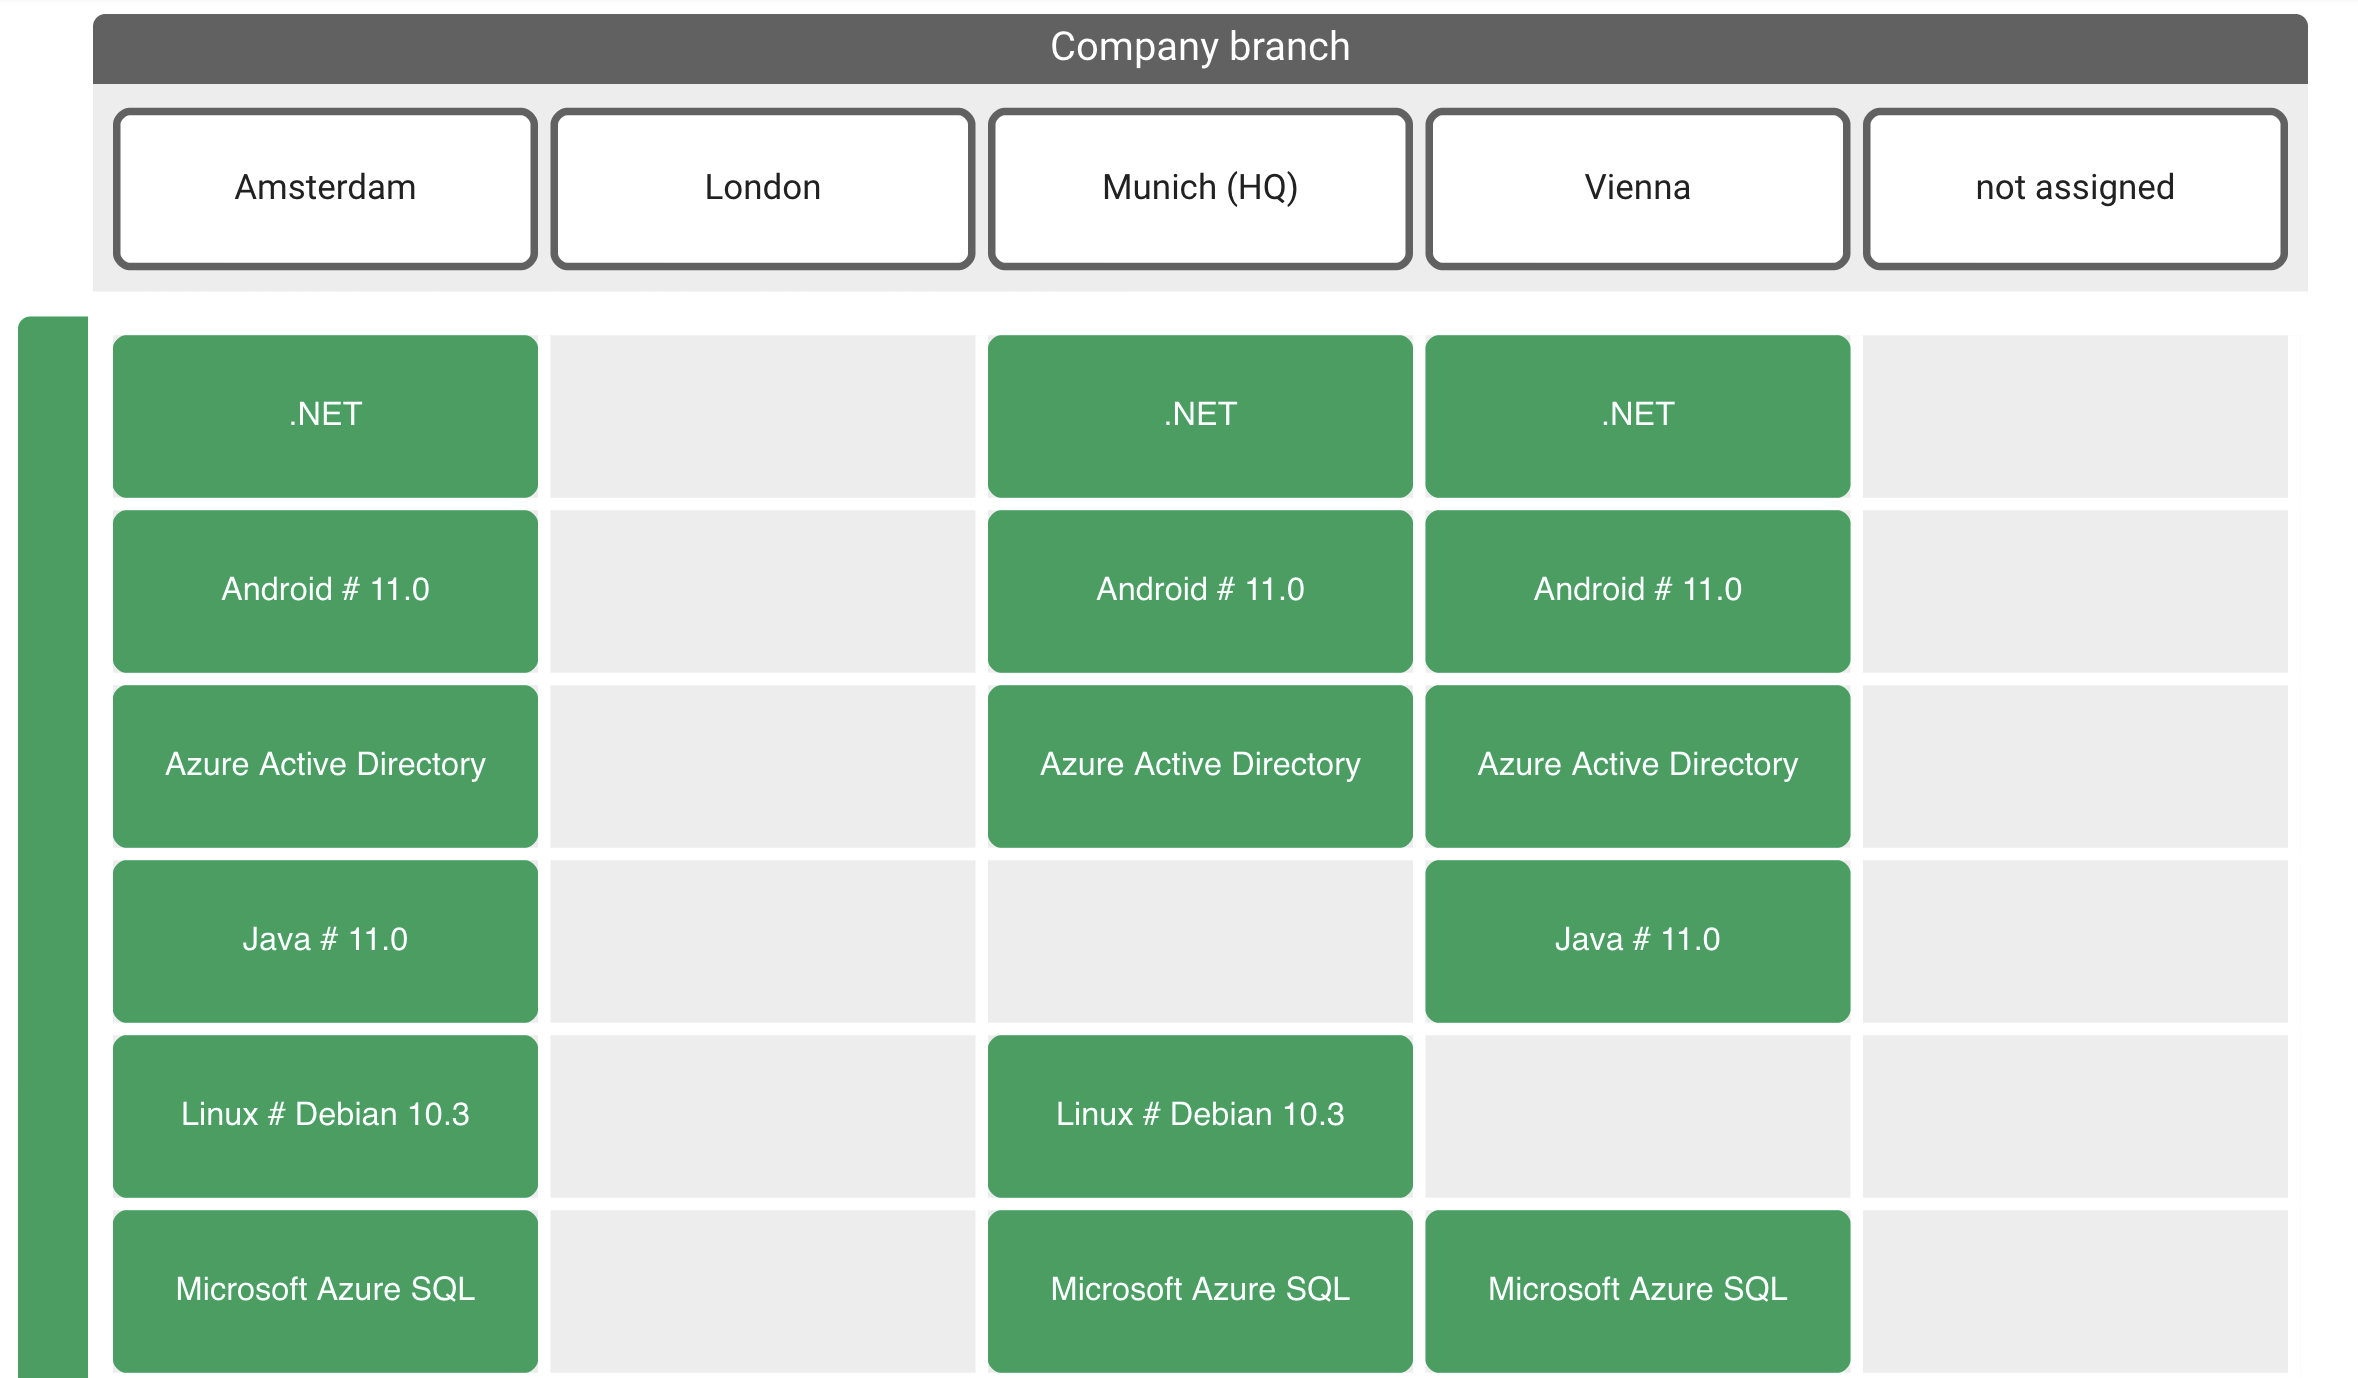
Display building blocks stacked on top of each other, sorted in columns and rows by using the cluster diagram. You can choose one building block type or attribute as the header and add a multitude of rows to visualize connected building blocks and assigned attribute values.
Example use case
There is a merger of two organizations and you want to see which departments use which information systems in order to note gaps or overlaps.

Choosing a header
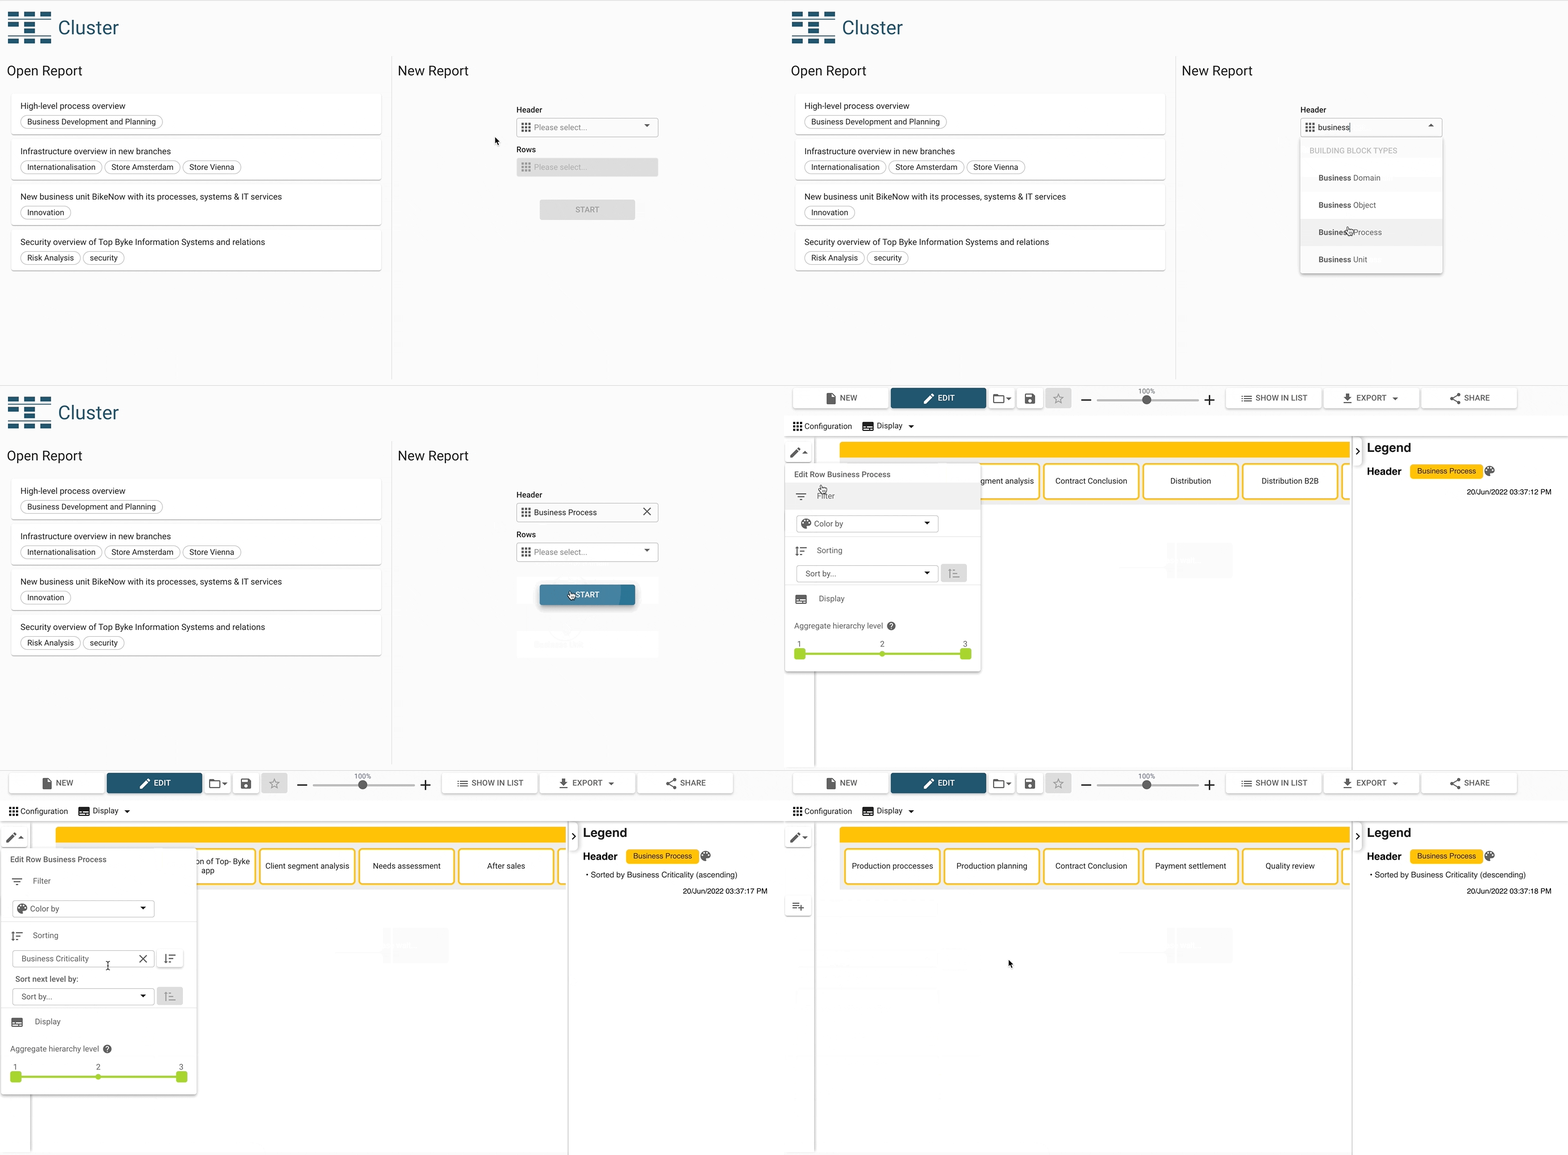
Start by choosing a building block type or attribute as the header of the diagram. The header is the central aspect of this diagram and all further types and attributes which can be added need to relate to the header elements.
The edit icon next to the header on the left side of the diagram opens a context menu with additional options. Filtering, coloring, and sorting is available in the dialog to customize the display of the header. There is also a display option to aggregate the hierarchy level.

Adding one or more rows
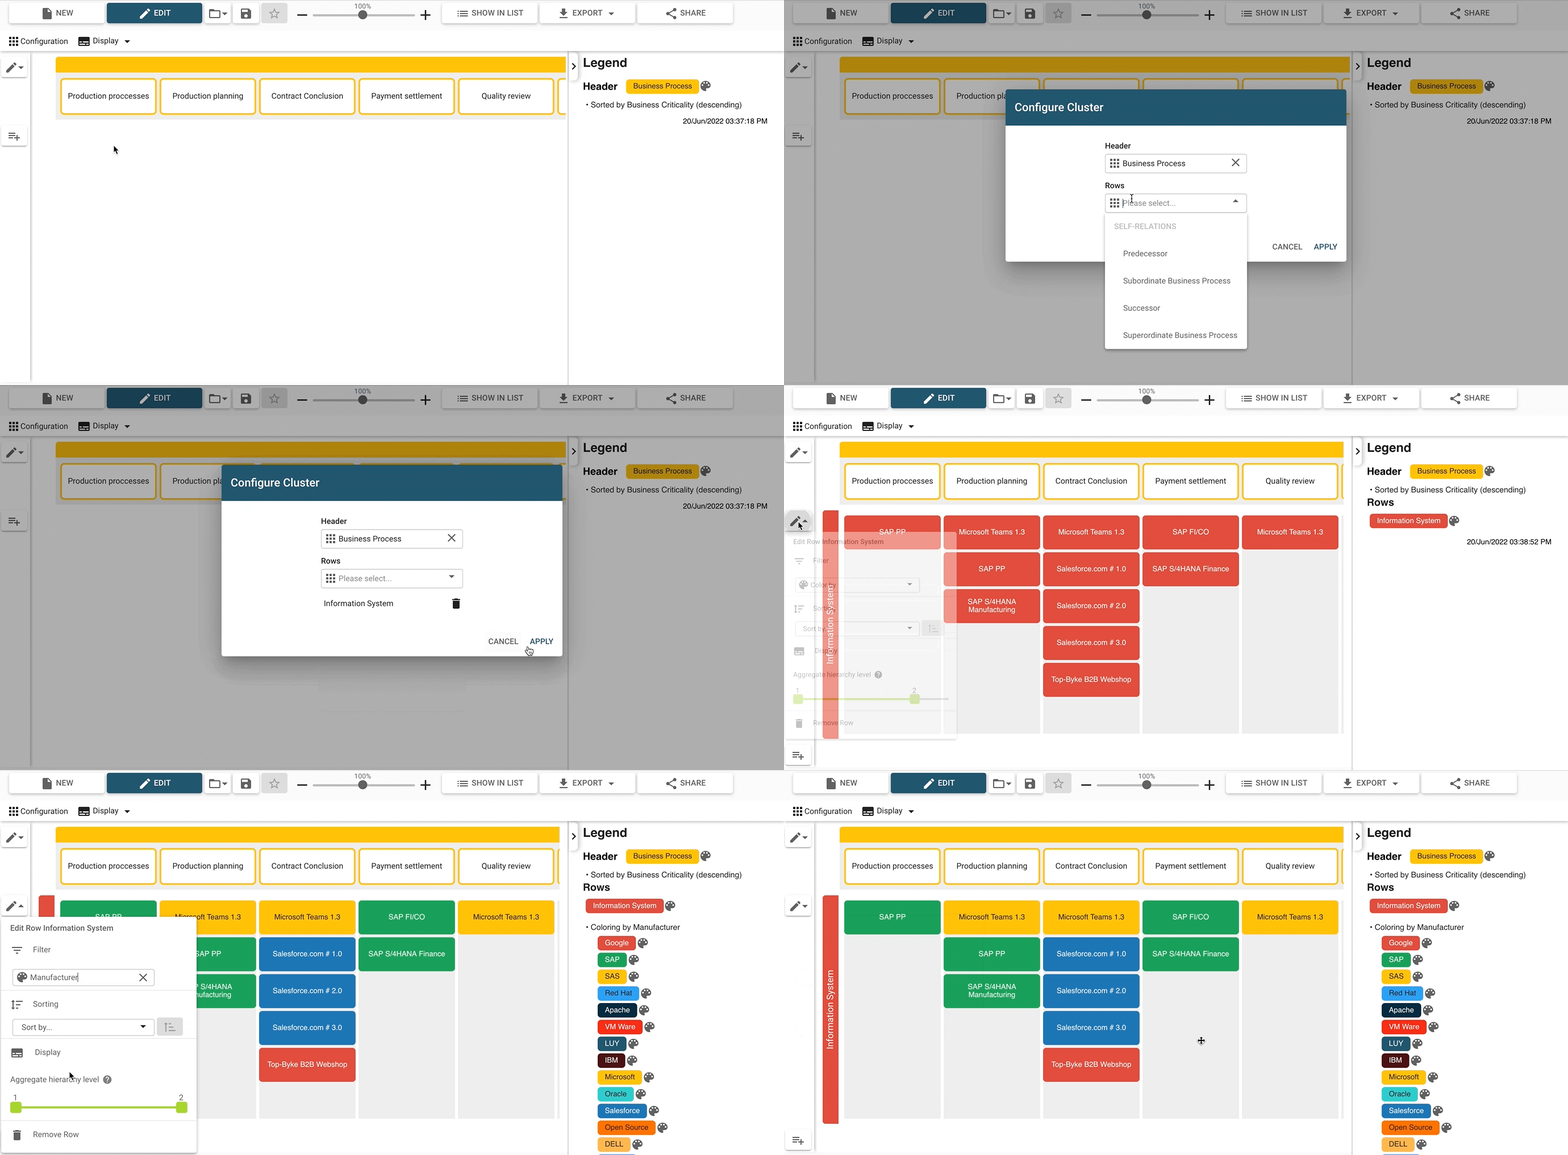
Add additional rows by clicking on the icon on the left side of the diagram. Building block types connected to the header type through relations or self-relations can be selected, as well as any attributes assigned to the header type.
The edit icon next to the row on the left side of the diagram opens a context menu with additional options. Filtering, coloring, and sorting for customizing the display of the row is available. There is a display option to aggregate the hierarchy level and the option to remove the row from the diagram.

Additional display options
Hierarchical names: Use this setting to display hierarchical building block names (the name of the parent element, if any, will be displayed, too).
Activate swimlanes: This setting causes each unique element within the rows to be displayed on the same height. This way, it is easier to spot in which column a certain element is contained.
