UPDATE - New table view shows reports with more details and makes navigation easier
November 2024
Release history
December 2024 - added editing date interval, enum and responsibility attributes (single selection)
November 2024 - added editing boolean, plain text and date attributes
October 2024 - added editing numeric attributes
July 2024 - update for attribute fields
February 2024 - improved relation group naming in the edit column sidebar based on user feedback, and added expand & collapse of relation columns
October 2023 - initial release
We’ve rebuilt the whole table view and rethought all its features to make your reports easier to read, show even more details, and make navigating through your data a joyful experience.
A full description of (previous) features can be found here: List view.
Right now, the page is in read only mode. This means while you can add and remove columns, change sorting, and filter your report, those changes are only temporary and will be reset when you leave the page.
Features
New header showing more details of a report
Now, our new header for table reports also shows the description as well as tags which have been added to this report. Click on show more to reveal all the details of the header. This gives users more insights into the context of a report. If the report contains a lot of elements the header will automatically shrink when scrolling down to make more room for the content.
Edit columns more easily
Adding and removing columns now works with the new edit columns sidebar. Here, attributes and relations are divided into two tabs and sorted into groups in order to easily find the right column to add.
Of course, you can also use the filter to search for an attribute or relation to add.
It is also possible to directly add attributes of a relation. You don’t have to add the whole group (as it is the case in our previous frontend).
Drag and drop columns, change size, and change sorting
Of course, columns can be moved via simple drag and drop. Clicking on the small arrows in the column header will activate sorting of the content by this column.
Clicking on the small pin-icon lets you pin up to three columns, so that they stay in the same place at the very left while you scroll through a lengthy list of columns.
New way of presenting attributes
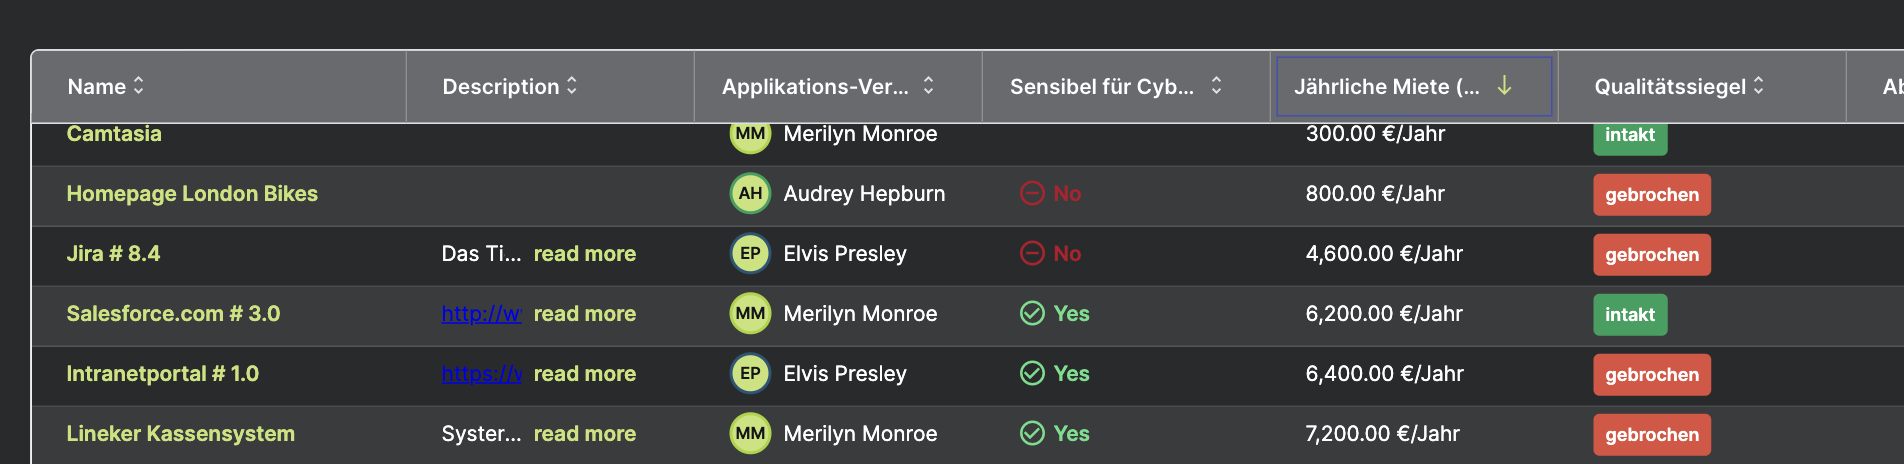
For the new table view we’ve redesigned all attributes, so that they show more information, as well as looking the same way wherever they are used (single element view and table view).
numeric attributes now also show the corresponding unit
relation attributes support mouse over to show the full name and are colored responding to the color set in the attribute
enum attributes are now colored correctly
boolean attributes are now showing icons, color and text
Edit attributes in the table view
Users with edit permission for the current building block type and relevant attribute group can edit attributes in the table view by double clicking on a cell. New values are saved by clicking Save, pressing the enter key or clicking on another cell in the table view.
Currently, the following attribute types can be edited in the table view:
numeric
boolean
plain text
single selection enum
single selection responsibility
date
date interval
The remaining attribute types will follow shortly - stay tuned!
Limitations
Be aware that for this first iteration our new frontend does not yet support every feature known to you in our previous LUY solution. These features will follow shortly.
The whole table view is read only, so while you can make changes like add columns, those are not saved and will be reverted to the last saved state of the report when leaving the page.
The advanced filter for attributes and relations is not yet available.
Edit mode is not yet available for all attribute types.