
The custom dashboard is a page which is easy to read and contains diagrams with the latest data. While creating a dashboard instance, choose which saved report is displayed on the dashboard. The custom dashboard supports the XWiki text formatting.
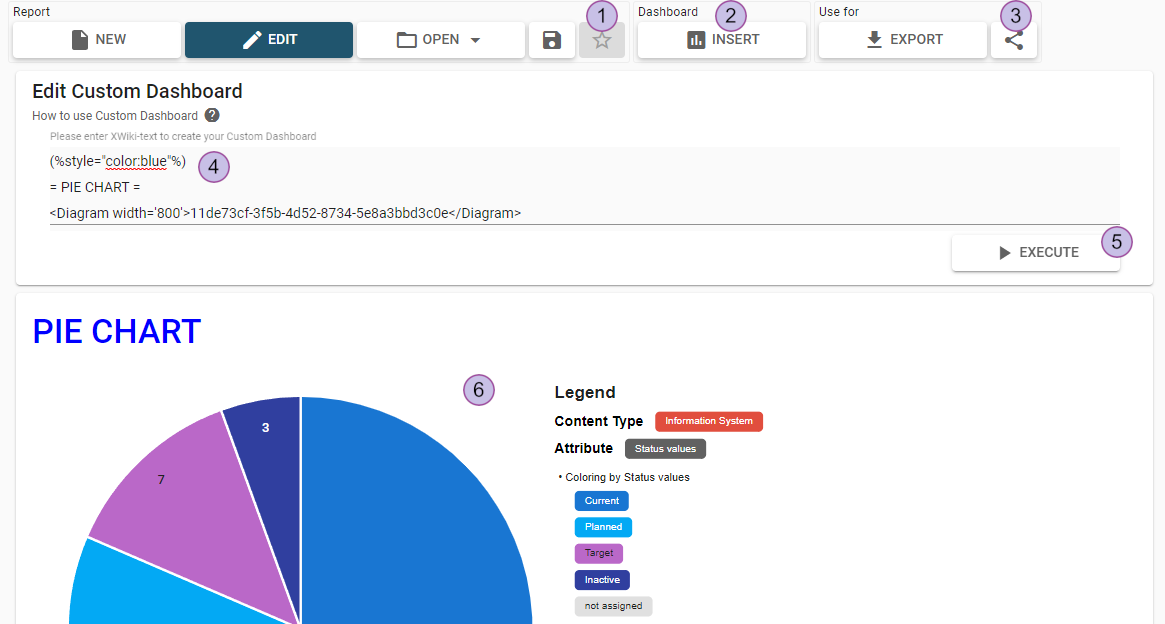
The custom dashboard toolbar contains several sections (1-4) for a better overview:
-
"Report" section:
-
Create new report
-
Switch between editing and read only view
-
Load existing report
-
Save report
-
Subscribe to current report
-
-
"Dashboard" section:
-
Open dialog to insert a saved diagram
-
-
"Use for" section:
-
Download custom dashboard
-
Share custom dashboard
-
-
Input field for XWiki text or to add a saved diagram report
-
Execute
-
Preview of custom dashboard
Custom dashboard input field
The custom dashboard input field fully supports the XWiki syntax and will convert the text with XWiki mark-up in the preview container. Additional information on the XWiki syntax can be found here.
Inserting saved diagram
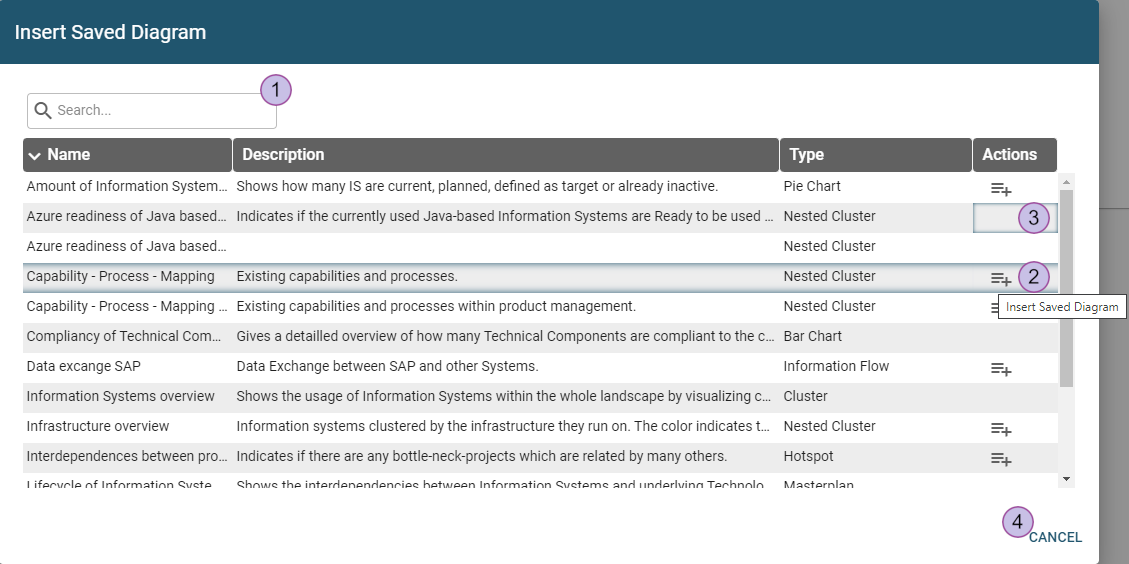
By clicking the “insert” button, the following pop-up dialog opens:
-
Quick search
-
Add the saved diagram report to the custom dashboard
The diagram will be added as a custom tag to text area: <Diagram>UUID</Diagram> -
If the user doesn’t have permission for the report, there is no action button
-
Cancel the insertion of a saved diagram report
The diagram tag is created with a default width of 800. A height value can be added. Please specify width and height values only in single quotes (example: width='600') for proper rendering.
Create custom dashboard
A custom dashboard will be created when “execute” button is pressed. The result will be shown in the preview below.