Diagrams
LUY offers a variety of interactive visualizations to support you in your communication and decision making. All diagrams are generated using the live dataset of building blocks and their attributes, and can be customized using a wide selection of different configuration options.
Diagram types
Common diagram functionality
Saving and loading diagram reports
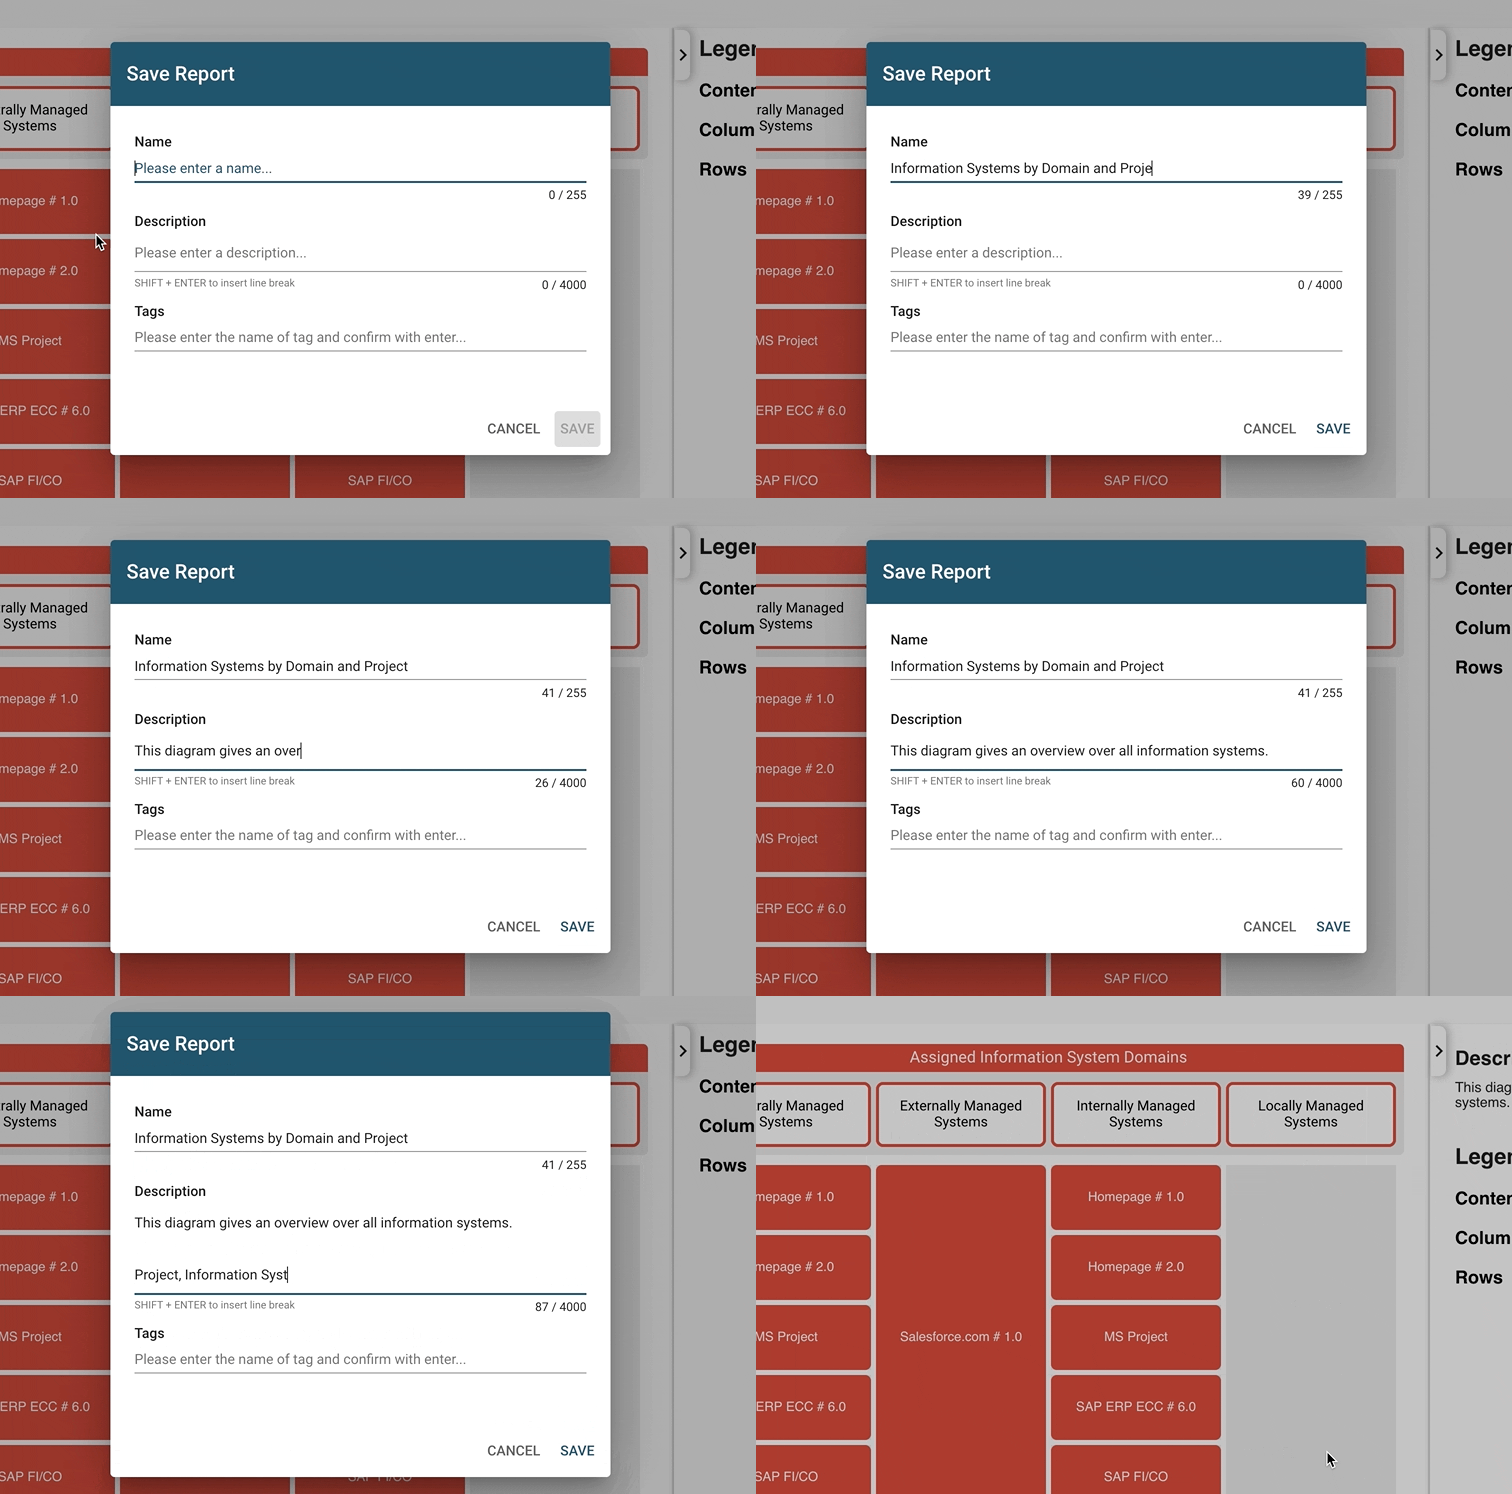
Diagrams can be saved and configured to make them available for subsequent use by you and your colleagues. Giving the report a meaningful name goes a long way in keeping a growing list manageable in the long-term. Specifing a description and tags to organize the list of reports is also useful.
It is possible to open a previously saved diagram from the diagram start page, or by using the “search for reports” button in the diagram toolbar. A reminder will be shown to save any unsaved changes before continuing to load the selected report.
Toggling edit mode
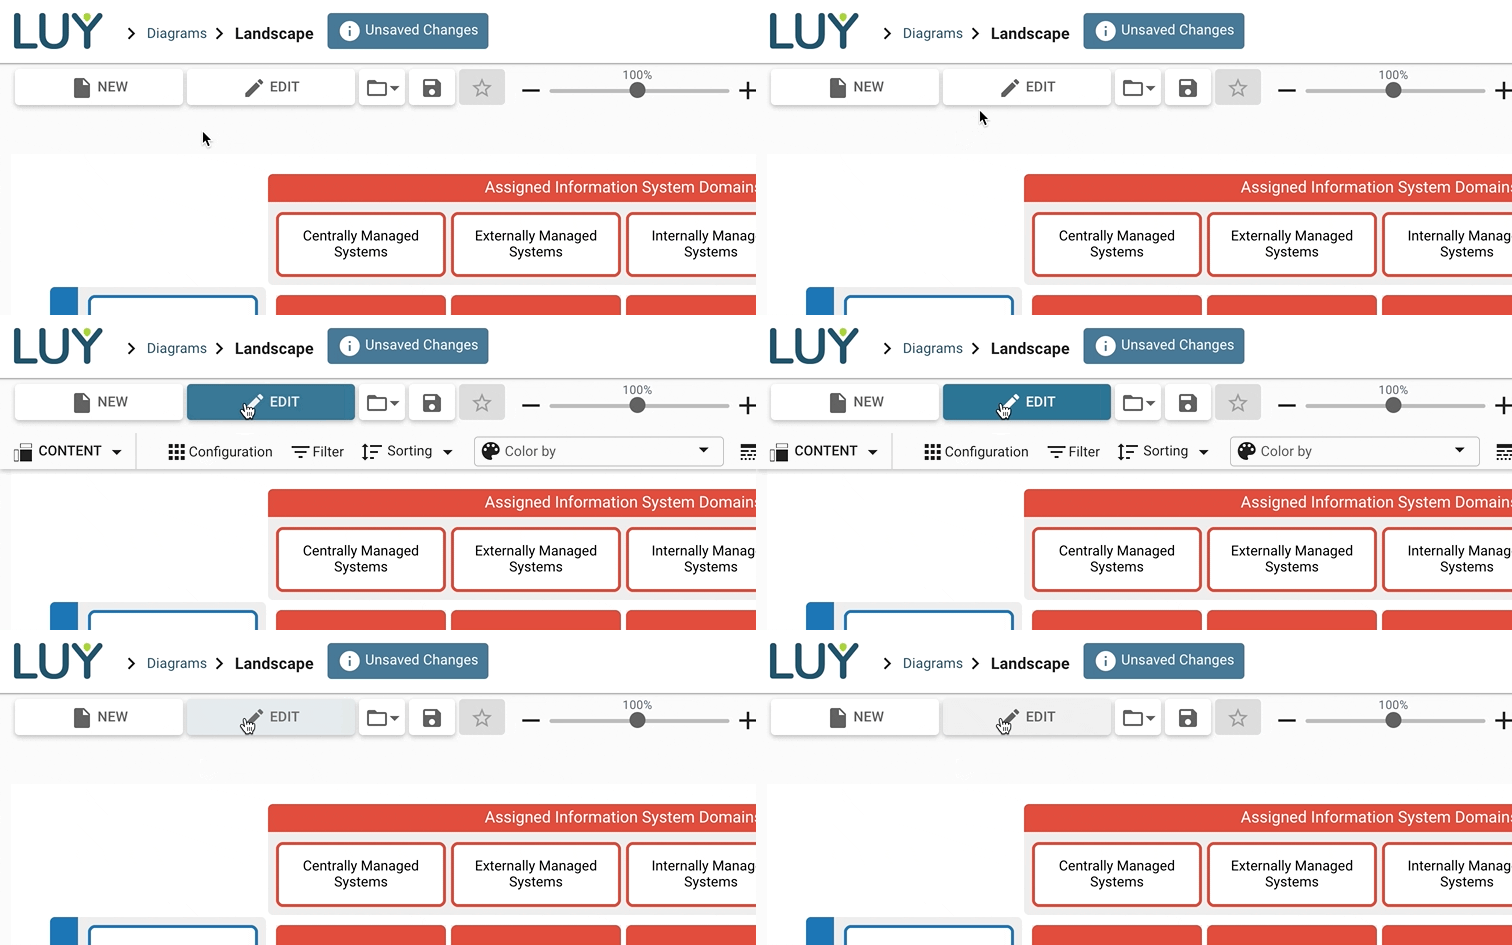
When opening a saved report, the diagram is initially set to view-only. This is helpful for presentation purposes, because it keeps the user interface simple by hiding the toolbar and other configuration instruments. It also prevents unintended modifications that could occur while exploring the diagram. Press “edit” on top of the diagram page to toggle edit-mode and access all configuration options.
Changing zoom-level
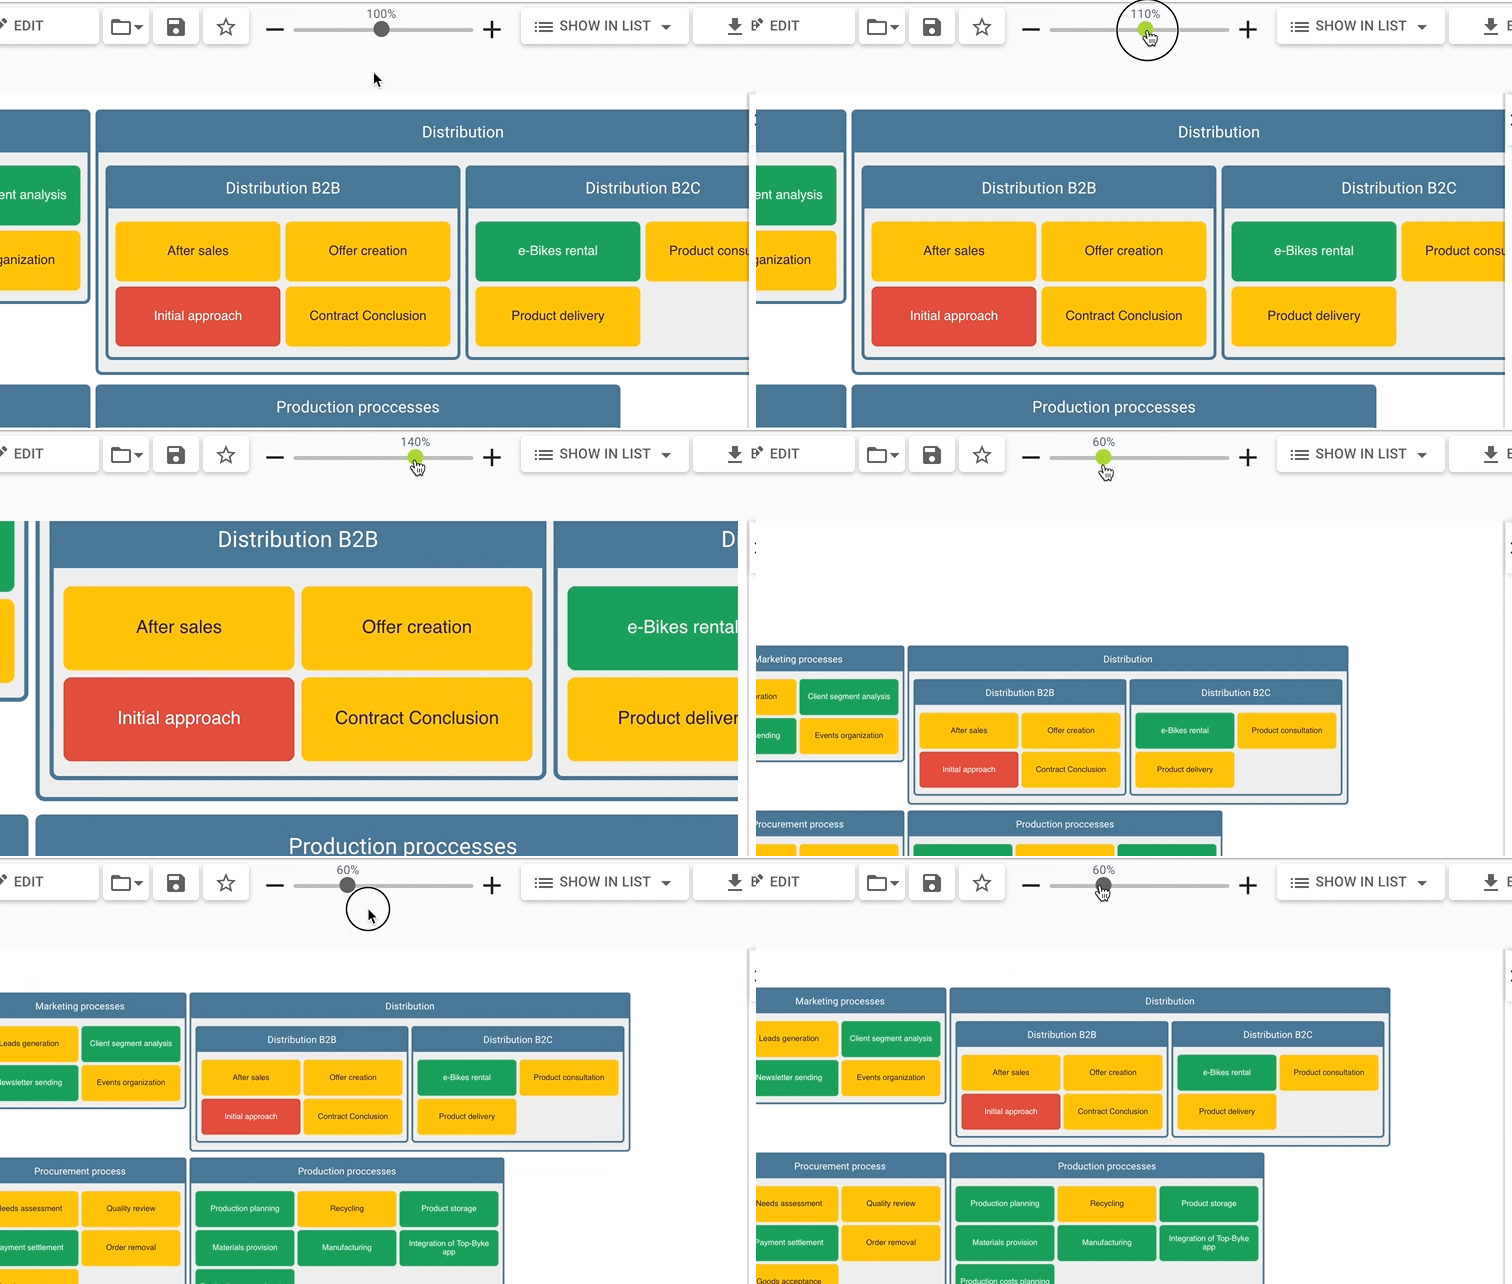
Diagrams with large datasets can get big pretty fast. Use zoom-level controls to display the diagram at the size that suits your needs. This can either be done by using the zoom slider on top of the diagram, or by controlling the zoom via the following keyboard shortcuts (make sure to focus the diagram first):
CTRL+mouse wheel up, or keypad "+" to zoom in
CTRL+mouse wheel down, or keypad "-" to zoom out
CTRL+0 to reset zoom (set to 100%)
SHIFT+Z to zoom to fit view
Applying filters
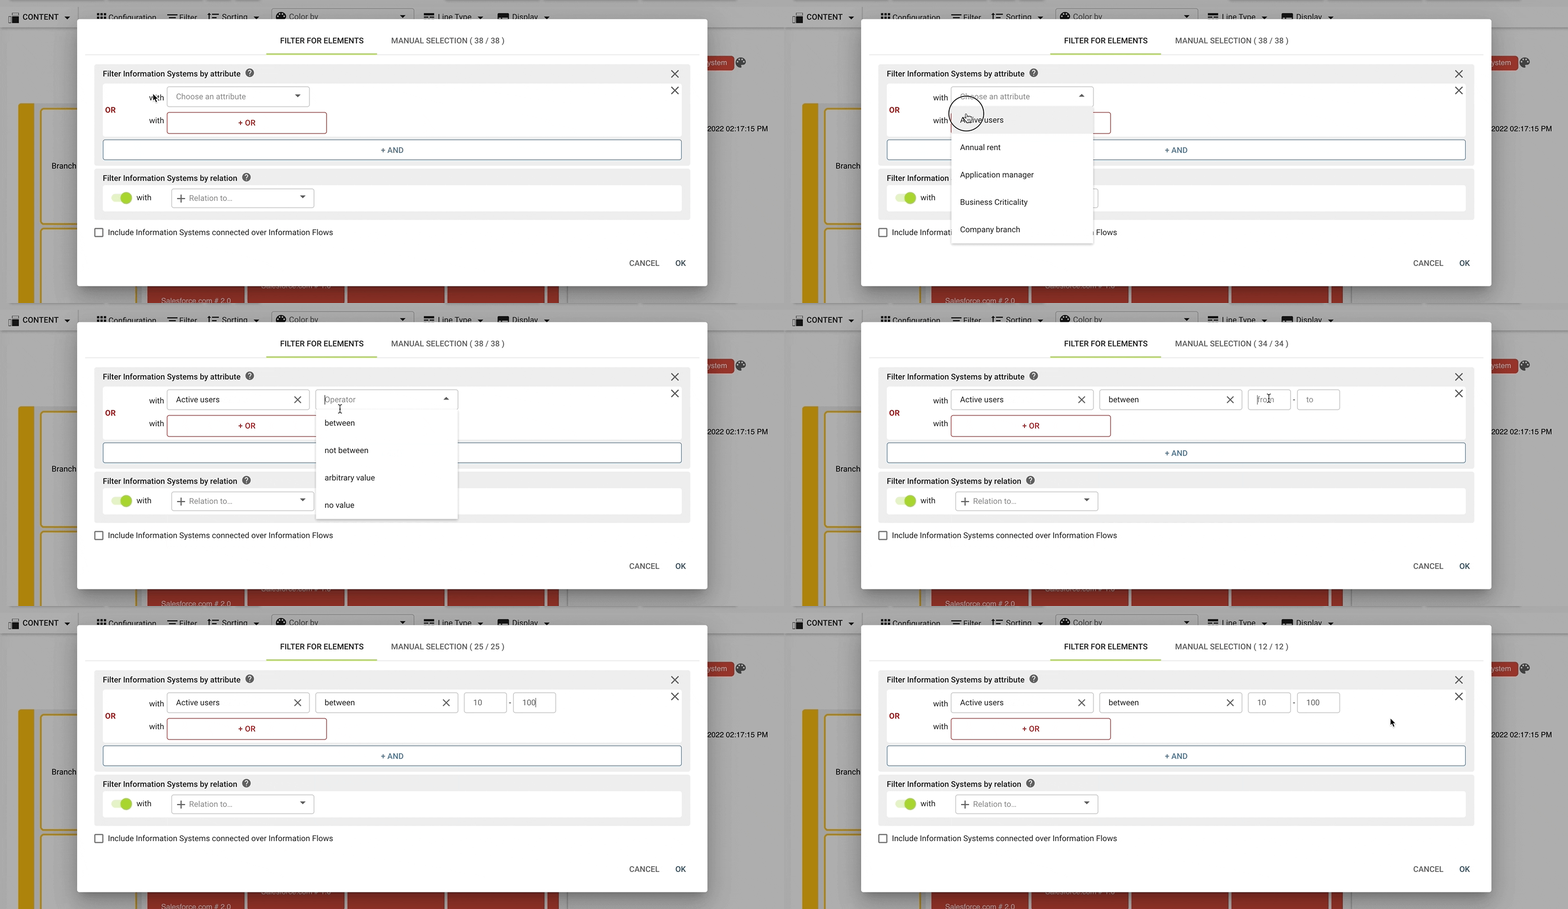
The set of displayed elements can be reduced by using the filter functionality. By default, diagrams use all elements of a selected type. Any attribute or relation can be filtered, combining multiple conditions via logical connectors, in addition a manual selection of elements can be set. Learn more about filters here.
Example use case
You visualize all projects at your company in one diagram, but you want to exclude the ones that are not currently running.
Coloring by attributes
Additional information in your diagrams can be visualized by drawig a selection in the “color by” dropdown. By default, the elements in each diagram are colored according to their respective building block type. Using the dropdown, a numeric, boolean or enumeration attribute attached to the type can be selected to color all elements according to their assigned attribute value.
The diagram legend shows which color is associated with which attribute value. By default, colors and color schemes defined in the attribute administration are used. Each diagram can be customized by clicking on the pipette and palette icons in the diagram legend and setting new colors.
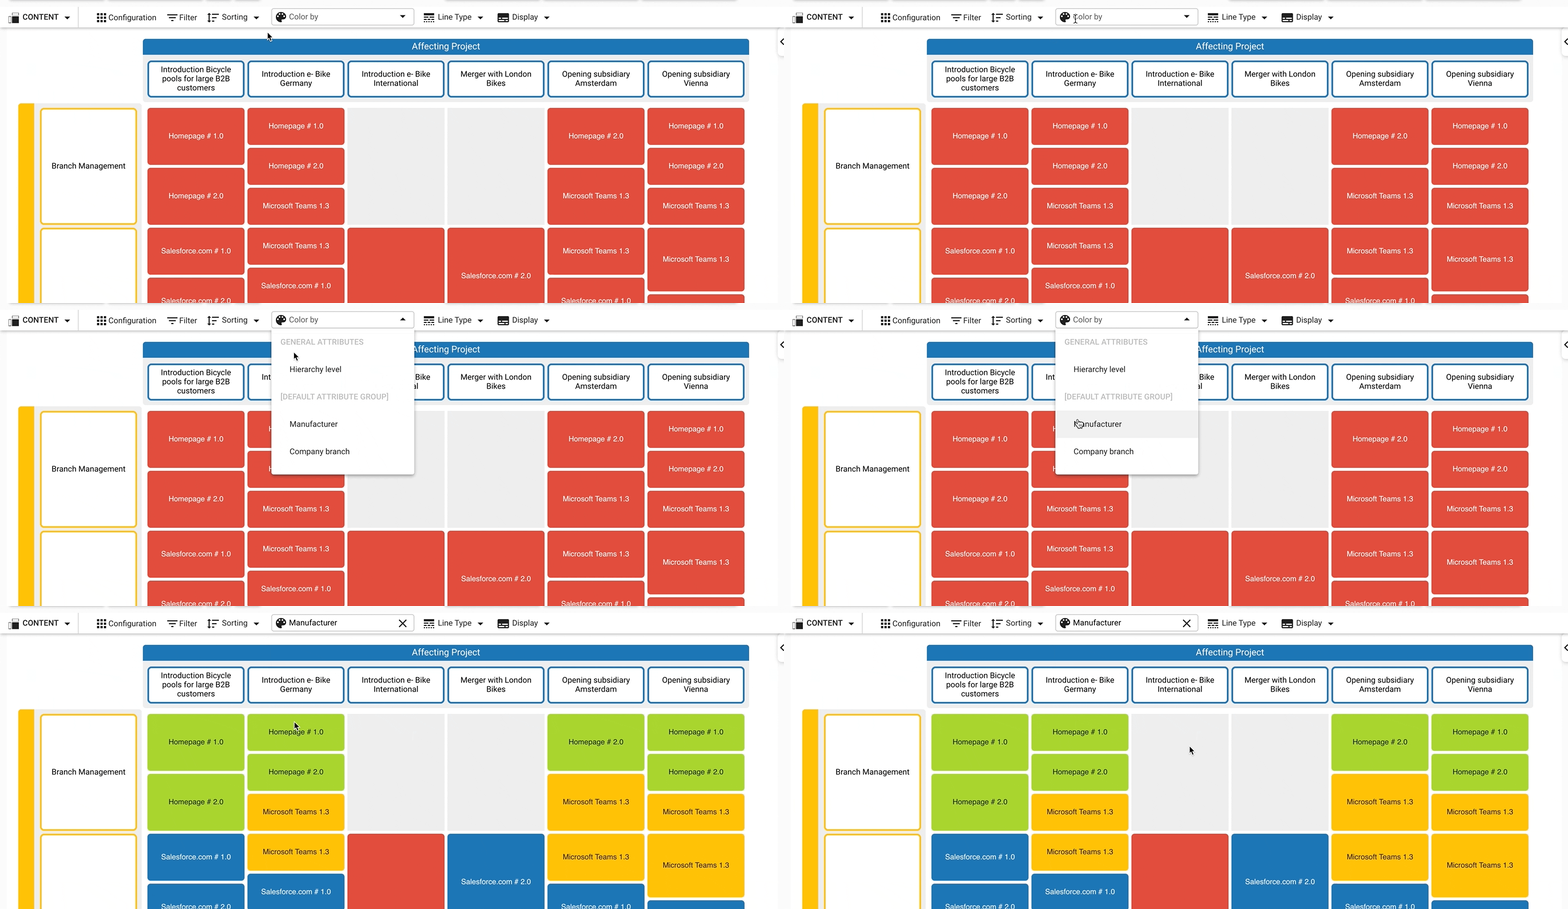
Example use case
You are visualizing a set of information systems and want to include additional information in the diagram, like their business criticality or vendor.
Changing the sorting order
A custom sorting order for elements using the “sort by” dropdowns can be set. By default, elements are sorted by name. Any text, numeric, date or enumeration attribute can be used, and all elements of that type will be sorted according to that attribute. The button next to the dropdown can be used to toggle between ascending or descending order. Up to two additional levels of sorting can be defined, which are used to determine the sorting order when two elements have the same attribute value.
Enumeration attributes are sorted either alphabetically or by position. The position is set in the enumeration attribute's detail page.
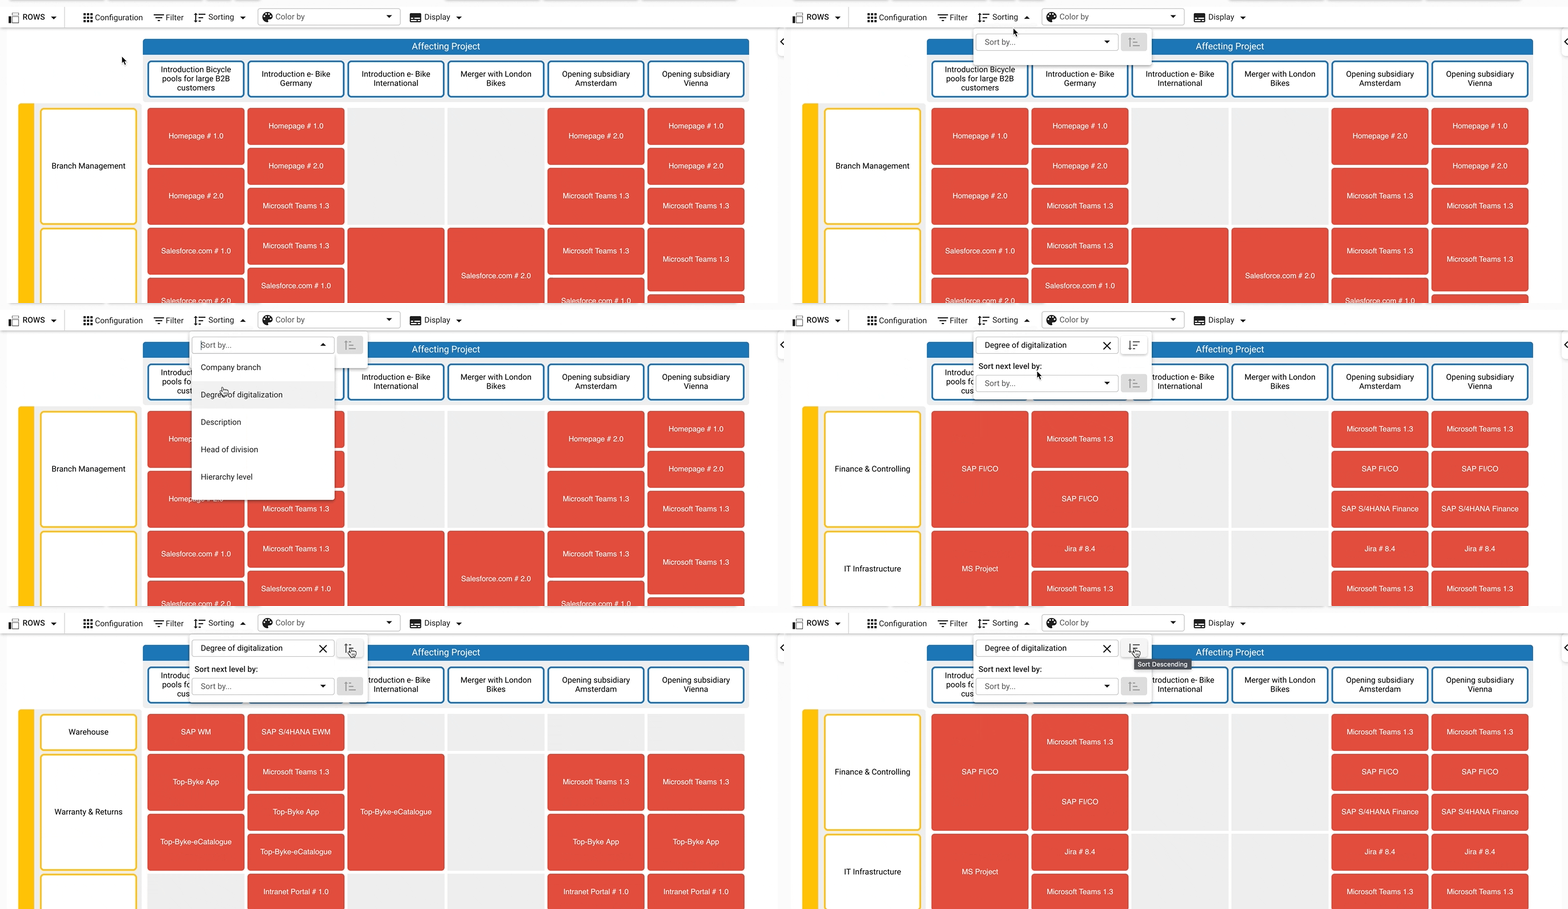
Example use case
There is a long list of information systems visualized in the diagram, but not all of them are equally important to the viewer. You can choose to sort them by descending business criticality, to view the most important elements on top.
Aggregating hierarchy levels
Aggregation facilitates the overview of hierarchical data, allowing to evaluate elements, their attribute values, and related elements from a more high-level or low-level perspective.
By aggregating elements to a higher/lower hierarchy level, their attribute values and relations are shown on the respective higher/lower hierarchy level. The attribute values and relations of aggregated building blocks are "inherited" by their ascendants/descendants. This makes it faster and easier to gain a higher-level or lower-level overview of a hierarchical data structure for data evaluation.
System attributes (e.g., id, position, hierarchy level) are not aggregated.
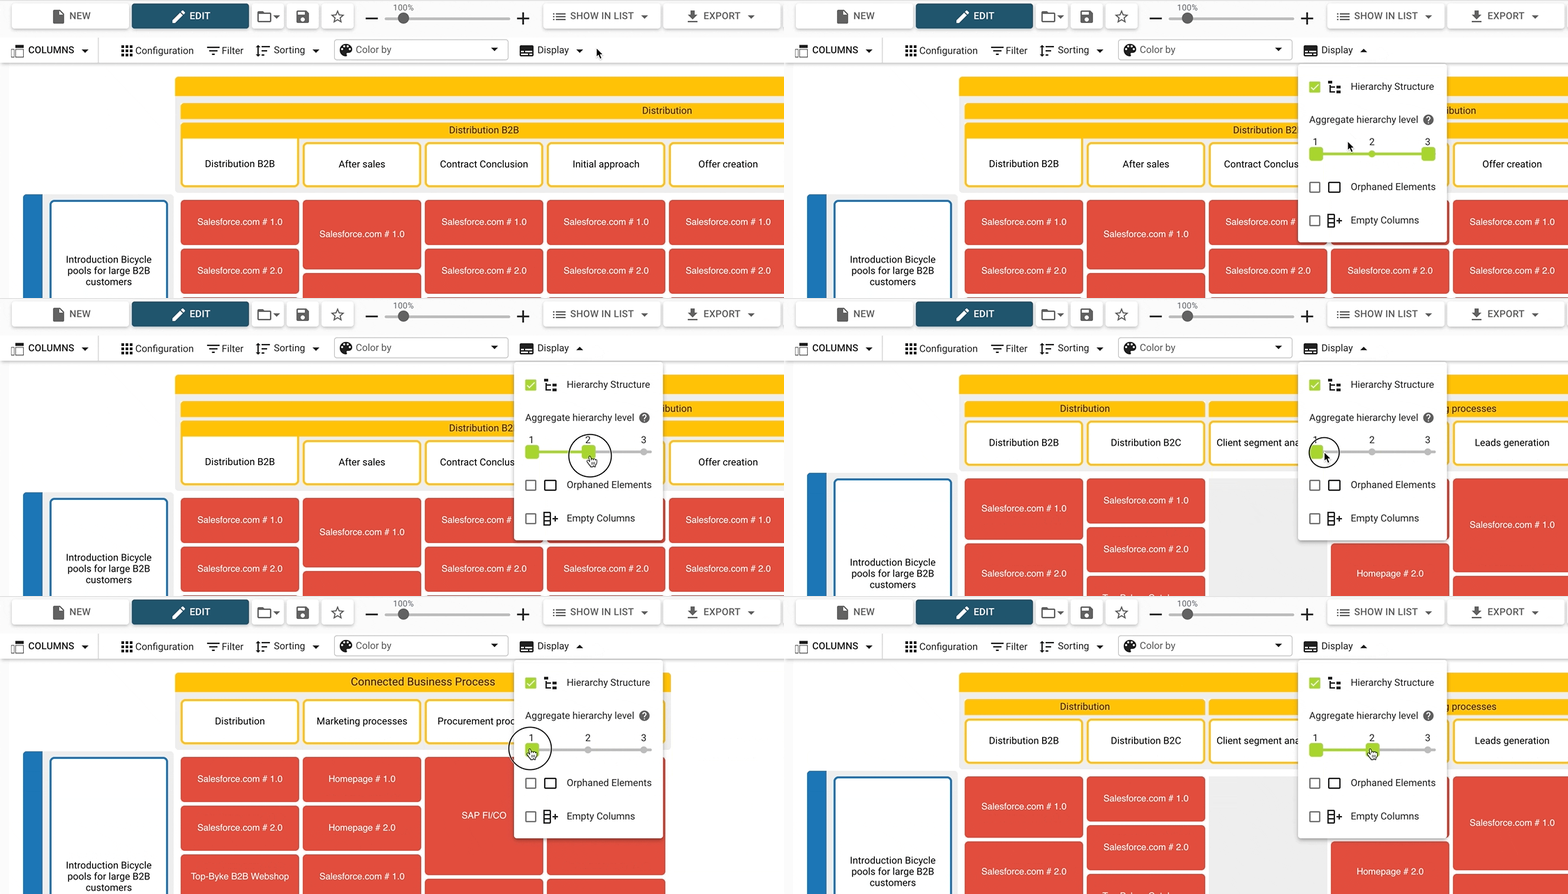
Example use case
You want to show all information systems which support a high-level business process, but all the relations between information systems and business processes are made on the lower levels. By aggregating to the highest hierarchy level, you can create a diagram that shows only the high-level business processes, but at the same time shows all the information systems with relations to lower-level business processes.
Diagram legend
The current configuration of a diagram is shown in the legend on the right-hand side of the visualization. It includes the description of the report (if specified), and a complete list of all currently applied configurations, like selected types, applied filters, or colorings. It is especially useful to understand what specific colors mean, as this information is usually not contained in the visualization itself. The legend is also included in any exports of the diagram.
In addition to getting an overview of the configuration, the diagram legend can also be used to customize colors. A pipette or color palette icon indicates if this functionality is available. This is useful if the default coloring should be overwritten for this specific report only.
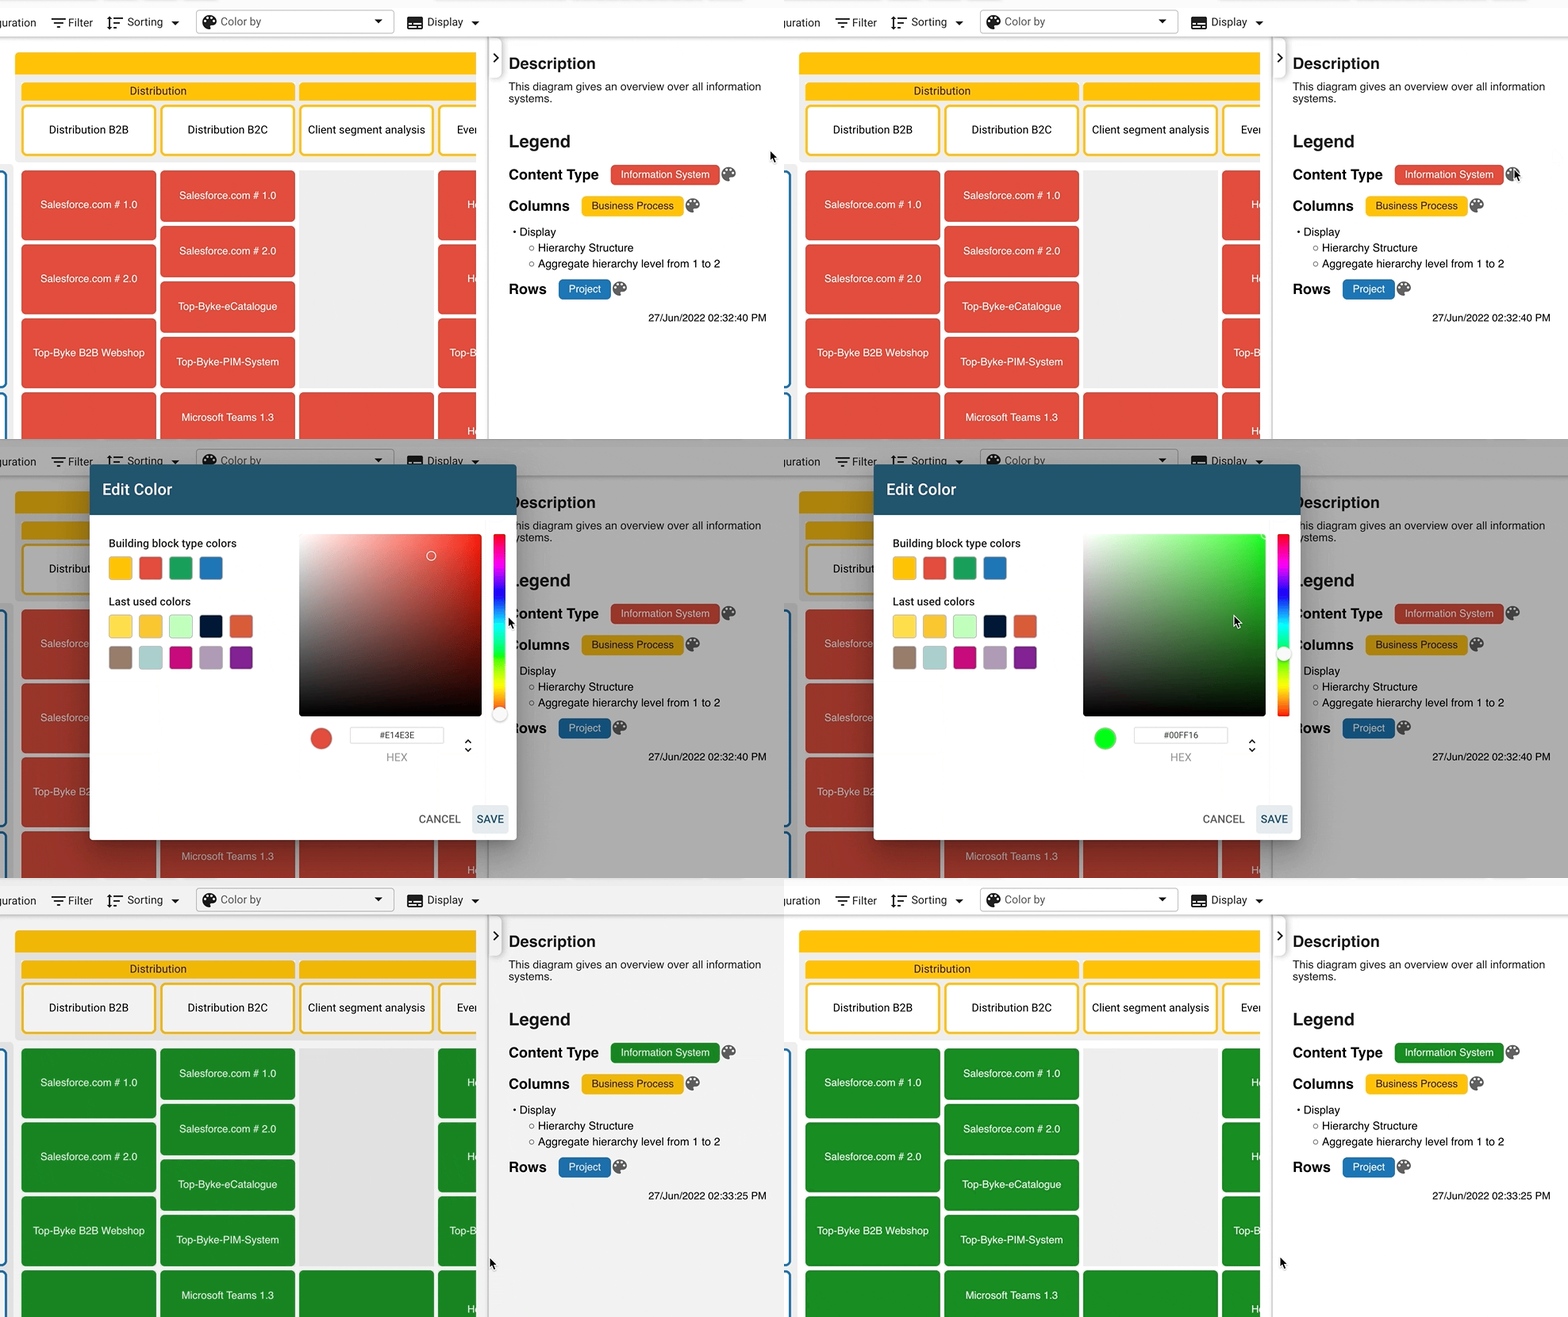
Subscribing to reports
By clicking on the “star” button the user subscribes to a report. This pins the report to the user’s start page and a notification is sent when someone else updates it.

Exporting image files
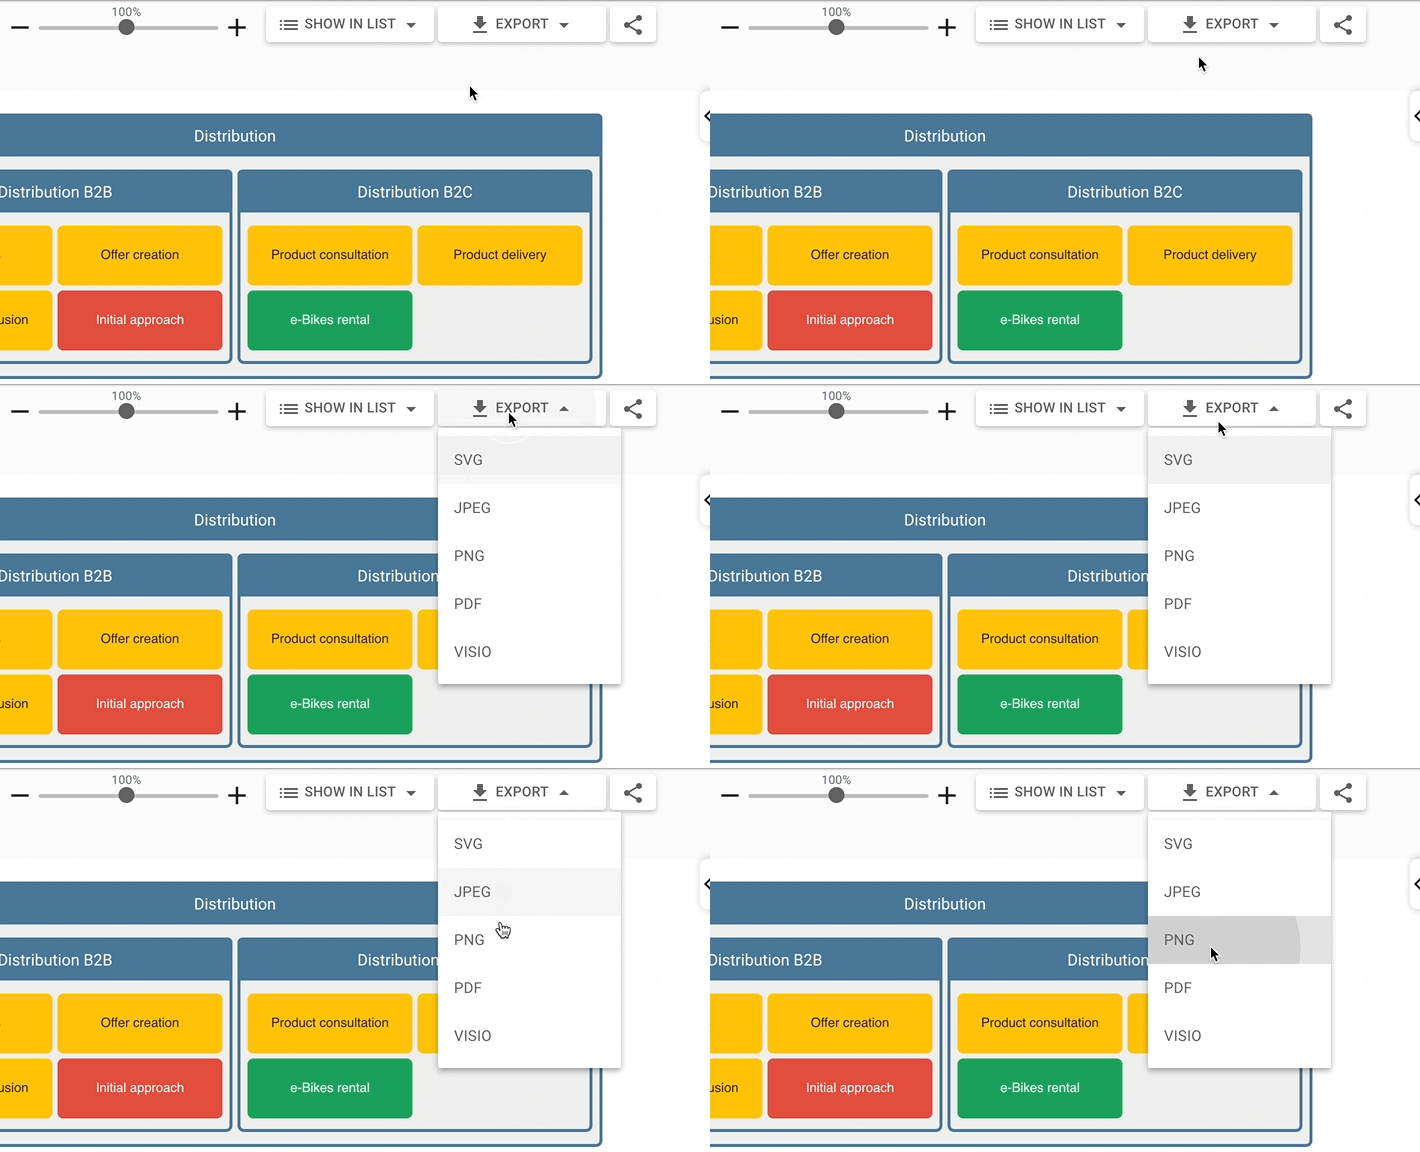
Diagrams can be downloaded as SVG, PNG, JPEG, PDF or VISIO files. The available file types depend on the type of diagram. The zoom factor used within the downloaded file is always 100%.
Sharing the diagram
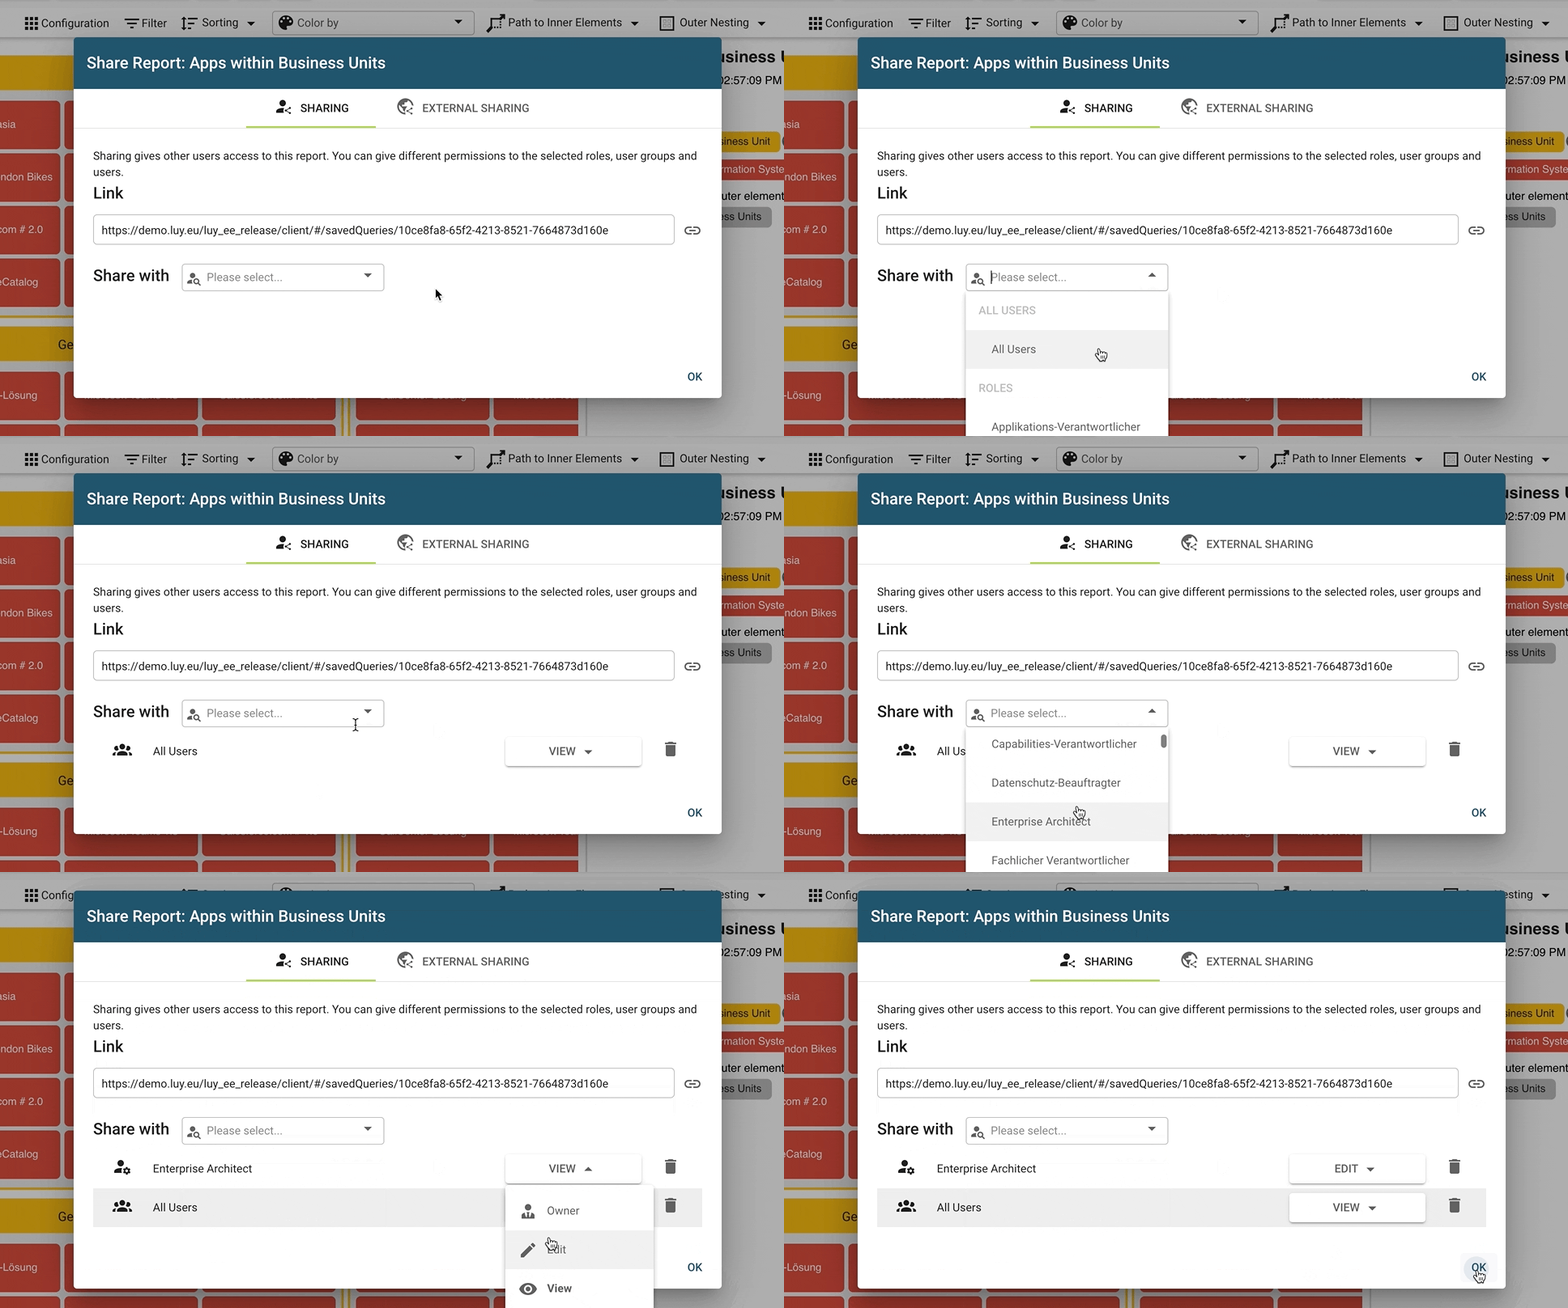
Use the sharing functionality for providing access to other users for the saved diagrams. Specify different permissions for specific roles, user groups, users, or all users.
There are three types of report sharing permissions:
View: users can only open these reports
Edit: users can open and edit the report’s content, name, description or tags
Owner: in addition to opening and editing, users can delete and share report with other users
The external sharing functionality allows the user to share an up-to-date version of the diagram for access outside of LUY. This means the external sharing link can be viewed by anyone, and a LUY login is not necessary. Different links can be shared in different languages and file formats. When an external sharing link is accessed, a corresponding up-to-date export is generated. For performance reasons, a caching mechanism might cause a few minutes of delay when making changes to the data.
Handling element limits
All diagrams have practical limits to the number of elements which can be visualized at the same time. This limitation exists to prevent performance problems in extreme cases. When this limit is exceeded (the concrete number depends on the diagram and browser, and can be customized in the administration section), a partial diagram warning is shown on top of the diagram. Whenever a partial diagram is shown, the export button shows an option for a "full export" of the diagram. Adding more restrictive filters to reduce the overall number of elements is possible, as well as changing the partial limits settings in the administration section.
Be careful with partial diagrams, as important parts of the diagram might not be shown.
